


KMLM: A History of Performance During Crises
Introduction
The macro events of 2022 caught most investors off guard, as stocks and bonds experienced a historical downward trend. In the decade leading to 2020, investors enjoyed a 60:40 balance of low inflation, low volatility, and steady returns in stocks and bonds. Bonds provided instant diversification* whenever stocks suffered a setback, and global central banks ensured risk markets remained stable by keeping inflation under control. However, the current situation is vastly different, as the Fed attempts to combat the highest level of inflation seen in four decades without intending to halt until a breakthrough is made. Compounding this, with the recent regional bank crisis (plus Credit Suisse), the Fed must now choose between fighting inflation and maintaining financial stability.
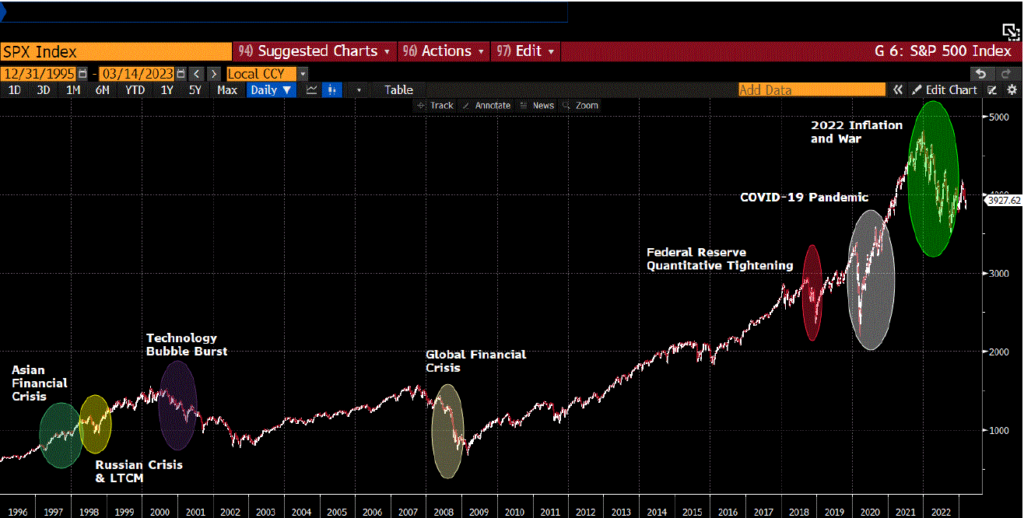
KMLM’s Index, the KFA MLM Index, a trend-following index that goes long and short in 22 markets across the Global Fixed Income, Currency, and Commodity sectors, has faced several bank-run crises since its inception in 1988. As the name suggests, the Index follows price movements and capitalizes on trends, allowing it to access both sides of the return distribution. This article examines various historical market crises, each with distinct characteristics and speeds of development and length. We’ll present the Index’s positioning at the onset of these events, it's evolving position throughout the events, and its performance relative to stocks, represented by the S&P 500 Index. It's worth noting that the KFA MLM Index has weathered past crises and is expected to face more in the future.
March 2023: Regional Bank Crisis
The situation surrounding the regional bank crisis seems largely resolved as of this writing, but the combination of interest rate volatility and trend reversals during the month posed challenges for many Managed Futures strategies. At the beginning of the month, the Index held short global bond positions (only in the 10-year tenor), long positions in the Dollar (via short foreign futures), and had mixed commodity holdings (short energy, long meats/softs/metals, and mixed on grains). The recent market movements have had a significant impact on bond markets, with notable upward movements going against the trend.
However, the effect on the Dollar and commodity positions was largely immaterial. The Index outperformed its peers, who held additional short positions in shorter-duration global bonds, which had expanded exposures due to their lower volatility profile. The price moves were more significant, compounding the effect. At month-end, despite the gap higher in prices (which ultimately settled down), the Index remains short bonds across the U.S., U.K., and Germany. Canadian and Japanese Government bonds have moved into small long positions.
For the quarter, KMLM finished down -3.2%, escaping the quarter relatively unscathed in a volatile trend reversal amid a 7.5% rally in the S&P 500. While we will concentrate on the performance of the KFA MLM Index during historical crises, when evaluating any investment strategy, it is important to look at the entire track record of the index, which can be found here. Managed Futures strategies generally tend to do better during extended periods of market volatility and economic stress, as it owns the investment premium associated with accepting price risk in the futures markets. Where Managed Futures strategies have historically faced headwinds to performance are during extended periods of low volatility, where markets and prices are more stable.
For KMLM standard performance, top 10 holdings, risks, and other fund information, please click here.
The Year 2022
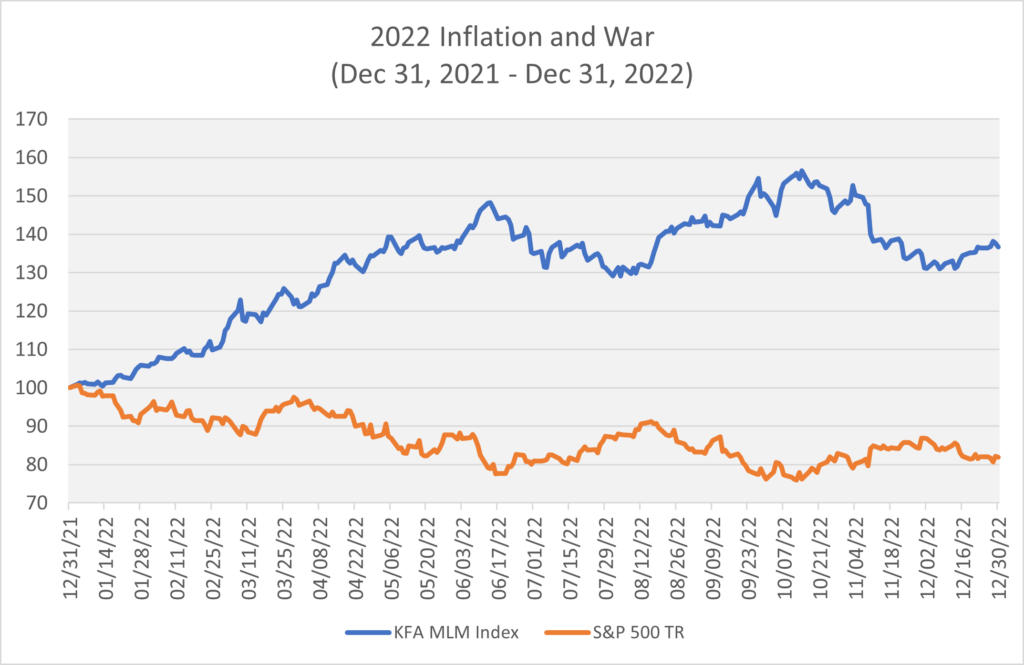
In 2022, the Index's returns were boosted by its reasonably sized long commodity portfolio at the start of the year. This contributed to returns in the first two quarters as the Ukraine War worsened the already constricted markets, particularly in the energy and grain sectors.
However, as commodity prices peaked and began to decline, the Dollar and global bond markets started to move during the summer. This resulted in returns through the end of the third quarter. In the fourth quarter, the Index's performance slightly decreased as the bond and Dollar movements stabilized and bounced off their highest and lowest points.
COVID-19 Pandemic
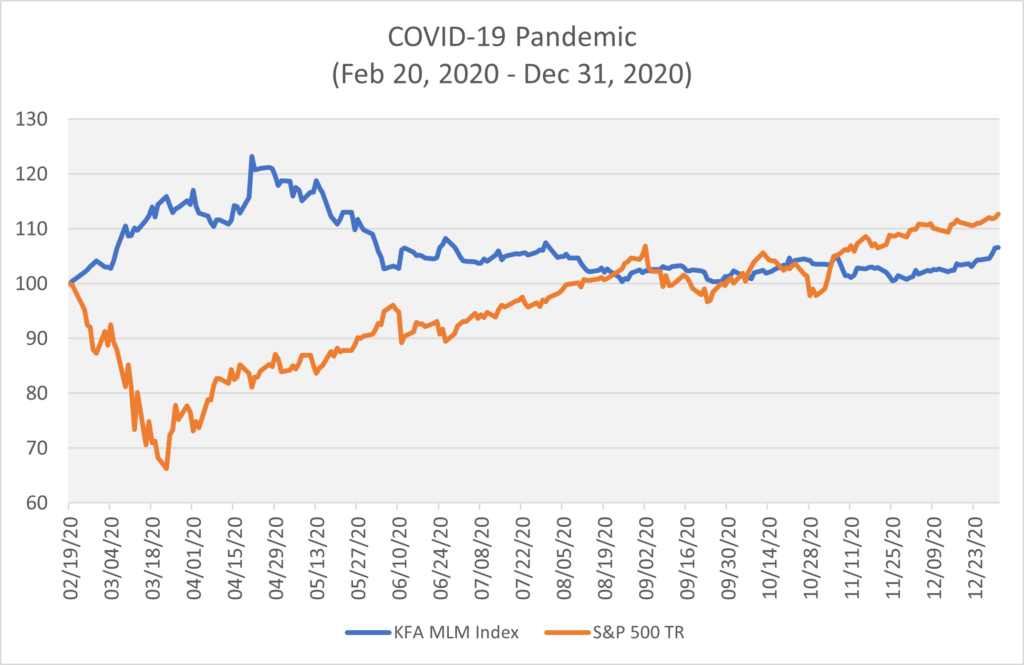
At the onset of the pandemic, the Index had already taken short positions in energy markets, as prices had begun to decline in January 2020. As the pandemic escalated in late February, these energy positions provided significant diversification* for the Index. Meanwhile, the flight to safety led to lower foreign futures prices and higher bond prices, where the Index was well-positioned.
The fiscal and monetary response that followed quickly rallied markets in the second quarter, leading to trend reversals in most markets that had earlier provided diversification* during the peak of the pandemic. Overall, the Index's performance for the year was modest but added value during the most challenging times for equities.
Federal Reserve Quantitative Tightening
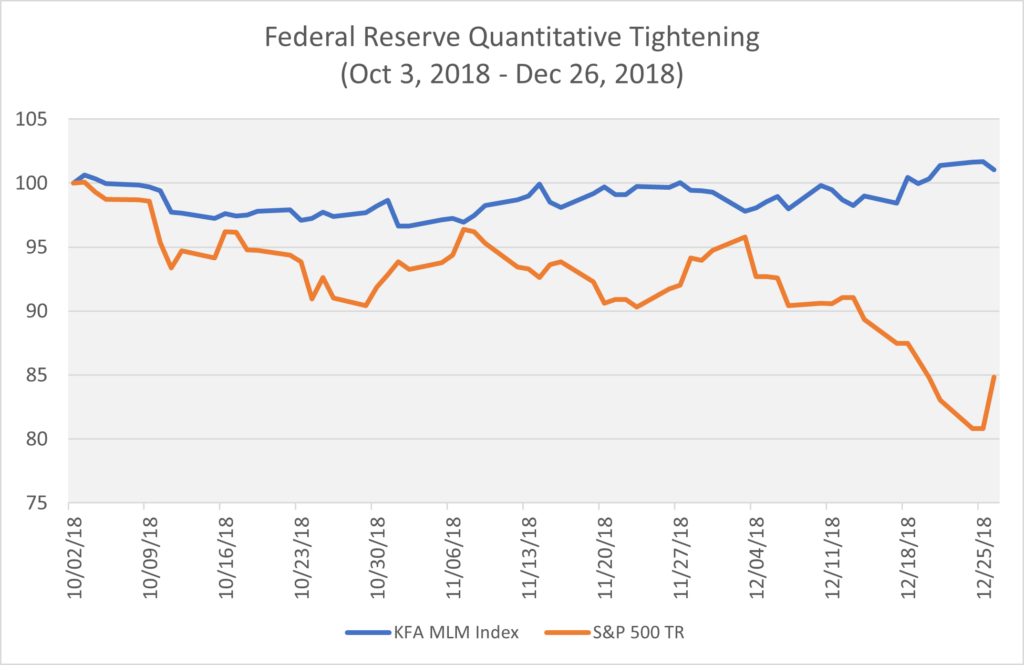
At the beginning of the Fed’s Quantitative Tightening, the Index held long positions in the Dollar and had mixed positions in global bonds, with short positions in commodities, except for long energy. By the end of the period, the Index's positions had shifted, with long positions in the Dollar and global bonds and short positions in commodities. Despite an almost 20% drawdown in equities, the Index's performance remained relatively flat.
Global Financial Crises
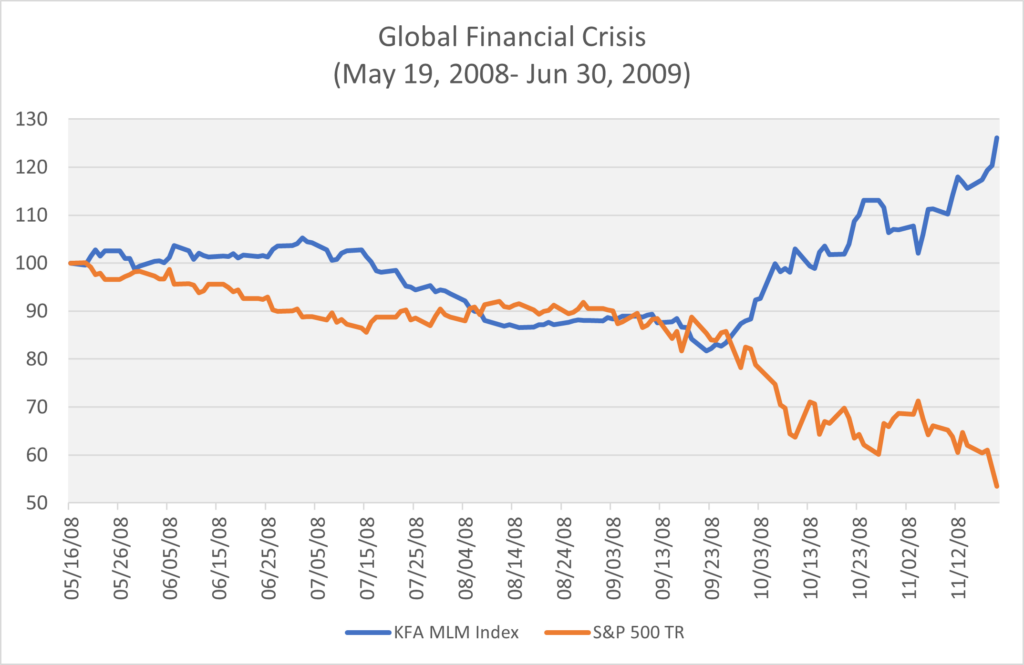
Following a surge in energy prices during the summer of 2008, the Index entered the fall of the same year in an unfavorable position. In September, the Index began building long positions in bonds and the Dollar. Although commodities, especially energy markets, were starting to develop some short positions, this trend accelerated towards the end of the month. When markets collapsed in the fourth quarter, the Index was well-positioned to benefit from the resulting "crisis flows."
Technology Bubble Burst
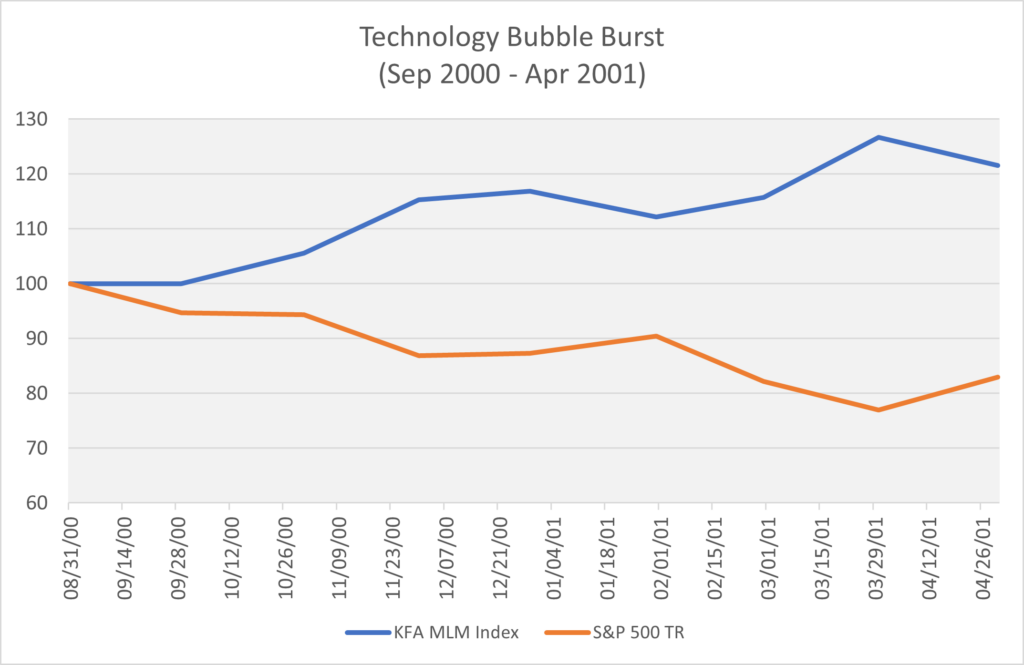
At the end of the tech bubble, the Index held long positions in bonds and the Dollar, which provided significant diversification* during the sell-off in equities.
Russian Crisis & LTCM
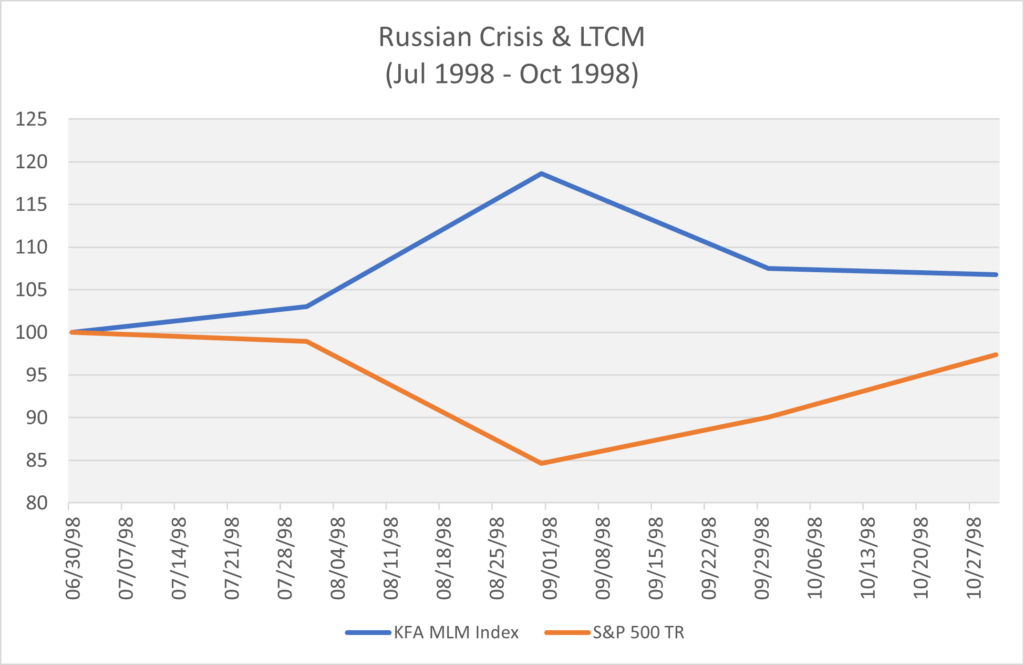
The short position in commodities, along with long positions in the Dollar and bonds, provided diversification* during the geopolitical and financial markets shock as Russia invaded Ukraine.
Asian Financial Crisis
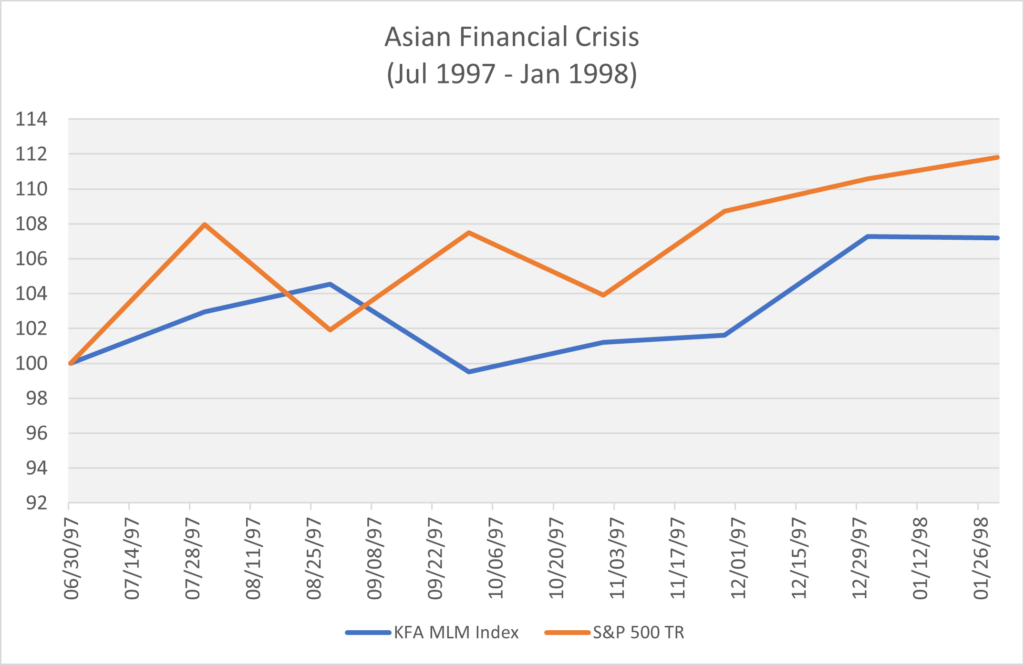
During the Asian Financial Crisis, the U.S. equity market was not significantly affected. The Index performed well, benefiting from short positions in commodities and long positions in the Dollar and bonds.
Conclusion
KMLM and its Index have demonstrated the value of a diversified* investment approach during periods of market turmoil. Throughout the various crises, the Index consistently utilized a combination of short positions in commodities, long positions in the Dollar, and long positions in bonds to provide meaningful diversification* and weather market downturns.
While the performance of the Index has varied during different events, it has generally outperformed its peers due to its tried-and-true trend-following strategy. As the global economy continues to face uncertainties, KMLM’s ability to adapt to changing market conditions and remain diversified* remains a valuable asset for investors looking to mitigate risk and maintain long-term portfolio growth.
* Diversification does not ensure a profit or guarantee against a loss.
Term Definition
Volatility: the degree of variation of a trading price series over time as measured by the standard deviation of returns. Standard deviation is a quantity calculated to indicate the extent of deviation for a group. A low standard deviation indicates that the data points tend to be close to the set's mean (also called the expected value). In contrast, a high standard deviation indicates that the data points are spread over a wider range of values.
Index Definitions
The MLM Index EV (15V) “Index” - serves as a price-based benchmark for evaluating returns available to investors in the futures markets. The Index applies a pure systematic trend-following algorithm across a diversified portfolio of 11 commodity, 6 currency, and 5 global bond future markets.
S&P 500 Index - a stock market index tracking the stock performance of 500 large companies listed on stock exchanges in the United States.