The latest news and research from our partners. Subscribe to our mailing list for more.
April 20, 2023 – Before SVB Collapse, Nancy Davis Warned of “Short Fixed-Income Volatility Exposure” on CNBC

April 3, 2023 – Has the US Fed Put Inflation Aside to Focus on the Banking Crisis?
March 27, 2023 – CNBC: Nancy Davis on 25bps Bump and IVOL

March 21, 2023 – Investing Strategy: Banking, Financial Crisis, Rate Hikes, SVB, Recession, Crash
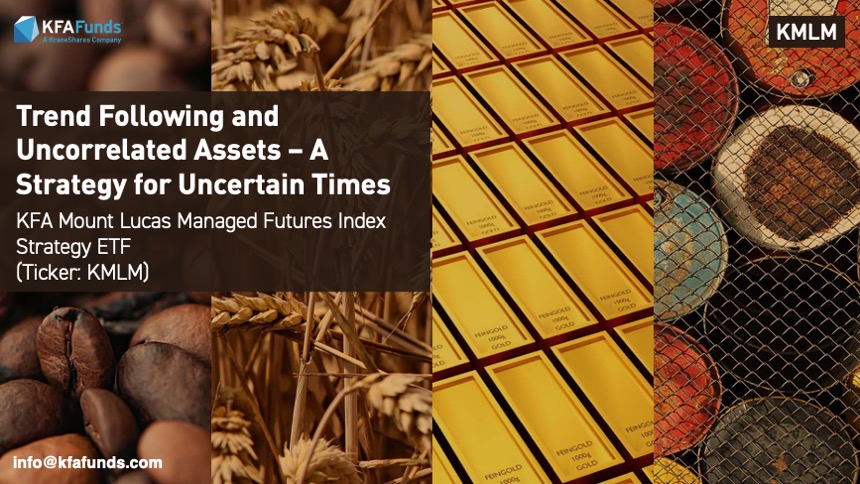
KMLM is benchmarked to the KFA MLM Index, which consists of a portfolio of twenty-two liquid futures contracts traded on U.S. and foreign exchanges. The Index includes futures contracts on 11 commodities, 6 currencies, and 5 global bond markets. These three baskets are weighted by their relative historical volatility, and within each basket, the constituent markets are equal dollar weighted.
Mount Lucas Management, the sub-advisor of KMLM, is a Newtown, PA based asset manager founded in 1986. Since its founding, Mount Lucas has provided innovative alternative investment strategies to institutional and high-net-worth investors that enhance and diversify traditional investments. Mount Lucas’ investment professionals have extensive experience in the development and use of systematic investment strategies that access alternative risk premia as well as a long history of discretionary macro trading and risk taking.
*Formerly the KFA Mount Lucas Index Strategy ETF
1. Buying and selling shares of the KFA Funds may result in brokerage commissions.
2. Diversification does not ensure a profit or guarantee against a loss.
3. Data from Mount Lucas Management.
Managed #Futures #funds had a positive quarter in Q1, and $KMLM was no exception. However, its returns were driven by its #commodity exposure rather than equities. Read the latest #market commentary from Mt. Lucas Management to learn more about KMLM’s #sector exposure and… pic.twitter.com/LIey3cdXPg
— KraneShares (@KraneShares) April 18, 2024
The KraneShares Value Line® Dynamic Dividend Equity Index ETF (Ticker: $KVLE) is designed to deliver high #dividend #income from higher quality and more conservative #stocks. The single largest holding as of early March? $MSFT, a massive growth company. Does this make sense?… pic.twitter.com/3TE56aeaBY
— KraneShares (@KraneShares) April 2, 2024


The Growth of $10,000 chart reflects an initial investment of $10,000 on the day prior to the selected time period and assumes reinvestment of dividends and capital gains. For the growth of $10,000 chart since inception, the initial investment of $10,000 is instead made on the inception date of the Fund. Fund expenses, including management fees and other expenses were deducted. The growth of a $10,000 investment in the fund is hypothetical and for illustration purposes only. Fund performance data used in this chart is based on Fund NAV and represents past performance. Past performance does not guarantee future results.
| Name | Identifier | Position | % NAV |
| GOLD 100 OZ FUTR DEC24 | GCZ4 | Long | 6.96% |
| LIVE CATTLE FUTR DEC24 | LCZ4 | Long | 6.83% |
| CORN FUTURE DEC24 | C Z4 | Short | 6.64% |
| SOYBEAN FUTURE NOV24 | S X4 | Short | 6.47% |
| COPPER FUTURE SEP24 | HGU4 | Long | 6.40% |
| WHEAT FUTURE(CBT) DEC24 | W Z4 | Short | 6.26% |
| SUGAR #11 (WORLD) OCT24 | SBV4 | Short | 6.18% |
| NATURAL GAS FUTR SEP24 | NGU24 | Short | 5.38% |
| WTI CRUDE FUTURE SEP24 | CLU4 | Long | 5.27% |
| GASOLINE RBOB FUT SEP24 | XBU4 | Long | 3.48% |
| NY HARB ULSD FUT SEP24 | HOU4 | Short | 3.42% |
| Name | Identifier | Position | % NAV |
| JPN YEN CURR FUT SEP24 | JYU4 | Short | 16.90% |
| BP CURRENCY FUT SEP24 | BPU4 | Long | 16.54% |
| CHF CURRENCY FUT SEP24 | SFU4 | Short | 16.44% |
| C$ CURRENCY FUT SEP24 | CDU4 | Short | 16.05% |
| AUDUSD CRNCY FUT SEP24 | ADU4 | Long | 12.91% |
| EURO FX CURR FUT SEP24 | ECU4 | Short | 8.60% |
| Name | Identifier | Position | % NAV |
| JPN 10Y BOND(OSE) SEP24 | JBU4 | Short | 26.63% |
| LONG GILT FUTURE SEP24 | G U4 | Long | 21.15% |
| EURO-BUND FUTURE SEP24 | RXU4 | Short | 18.59% |
| CAN 10YR BOND FUT SEP24 | CNU4 | Long | 18.30% |
| US 10YR ULTRA FUT SEP24 | UXYU4 | Short | 6.13% |
| Name | Identifier | Position | Current Exposure($) | % NAV |
| Cash | – | 108,192,488 | 108,192,488 | 30.41% |
| B 07/30/24 | – | 55,000,000 | 54,991,964 | 15.46% |
| B 08/06/24 | – | 55,000,000 | 54,935,432 | 15.44% |
| B 08/20/24 | – | 55,000,000 | 54,822,029 | 15.41% |
| B 08/29/24 | – | 55,000,000 | 54,750,407 | 15.39% |
| B 09/03/24 | – | 55,000,000 | 54,710,026 | 15.38% |
| BRITISH STERLING POUND | – | -3,797,616 | -4,889,047 | -1.37% |
| JAPANESE YEN | – | -761,824,094 | -4,954,309 | -1.39% |
| CANADIAN DOLLAR | – | -6,909,473 | -4,995,823 | -1.40% |
| EURO | – | -5,182,188 | -5,626,330 | -1.58% |
| 361,936,838 | 102% | |||
Holdings, futures, and collateral are subject to change.
| Rank | Name | % of Net Assets | Ticker | Identifier | Type | Shares Held | Market Value($) | Notional Value($) |
| 1 | Cash | 29.89% | – | – | Cash | 108,192,488 | 108,192,488 | 0 |
| 2 | B 07/30/24 | 15.19% | – | US912797KR75 | Treasury Bill | 55,000,000 | 54,991,964 | 0 |
| 3 | B 08/06/24 | 15.18% | – | US912797KW60 | Treasury Bill | 55,000,000 | 54,935,432 | 0 |
| 4 | B 08/20/24 | 15.15% | – | US912797KY27 | Treasury Bill | 55,000,000 | 54,822,029 | 0 |
| 5 | B 08/29/24 | 15.13% | – | US912797KD89 | Treasury Bill | 55,000,000 | 54,750,407 | 0 |
| 6 | B 09/03/24 | 15.12% | – | US912797LA32 | Treasury Bill | 55,000,000 | 54,710,026 | 0 |
| 7 | GASOLINE RBOB FUT SEP24 | 0.00% | XBU4 | – | Future | 122 | 0 | 12,384,708 |
| 8 | WTI CRUDE FUTURE SEP24 | 0.00% | CLU4 | – | Future | 243 | 0 | 18,749,880 |
| 9 | GOLD 100 OZ FUTR DEC24 | 0.00% | GCZ4 | – | Future | 102 | 0 | 24,764,580 |
| 10 | JPN 10Y BOND(OSE) SEP24 | 0.00% | JBU4 | – | Future | -102 | 0 | -94,736,555 |
Holdings are subject to change.
Hyperlinks on this website are provided as a convenience and we disclaim any responsibility for information, services or products found on the websites linked hereto.
Click here to continueYou are now leaving KFAFunds.com. Hyperlinks on these websites are provided as a convenience and we disclaim any responsibility for information, services or products found on the websites linked hereto.