


Yield Curve Inversion Opportunities: A Role for IVOL
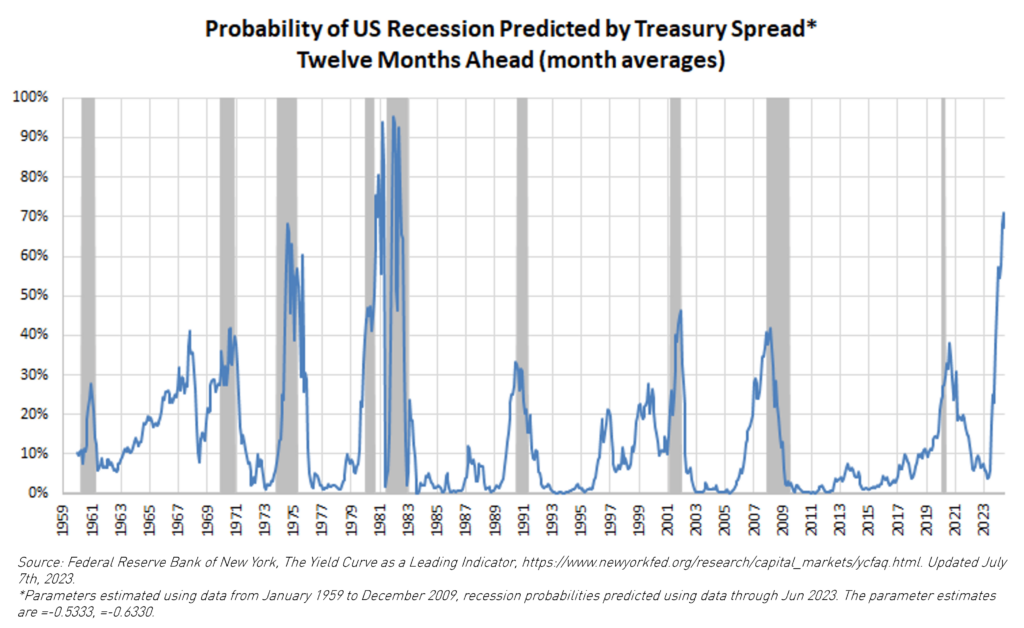
Yield curve inversions have historically been associated with impending recessions. The Federal Reserve Bank of NY maintains a chart tracking its perception of the probability of a recession over the next 12 months based on the shape of the yield curve. Currently, the NY Fed sees a 67.3% likelihood of a recession in the upcoming 12 months. This is the highest level this metric has reached since the early 1980s. So, the Fed currently sees a recession as very likely.
But 12 months is a long window for investors. Might we tighten that estimate up? If we look back at the last four recessions (1989, 2001, 2007, and 2020), we see that the yield curve started to normalize a few months before the start of the recession.
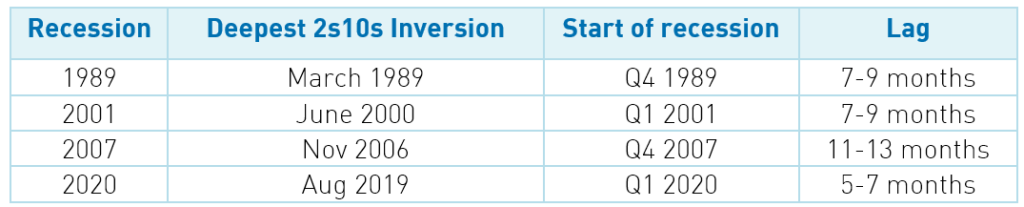
The pattern has held up well over the past 30 years: (1) Yield curve reaches maximum inversion. (2) Curve begins to normalize. (3) Recession begins between 5-9 months later (in one case, much longer). Note that during the recession, the curve typically continues to steepen. So, the normalization of the curve cannot be taken to signify avoidance of a recession. Normalization has occurred before and during all four recessions since the late 1980s.
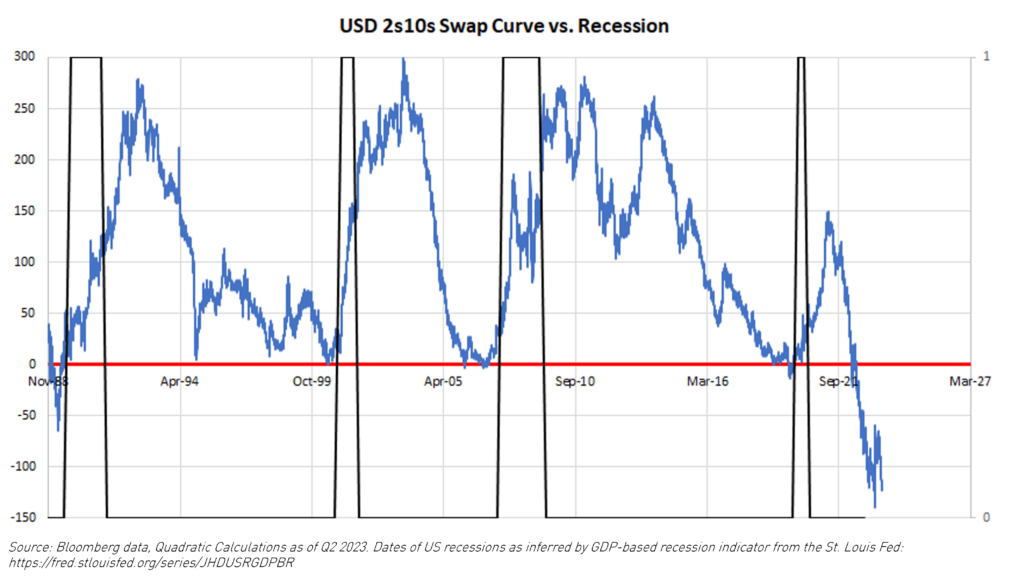
Another place to look for patterns is the swap curve. The swap curve only began in 1988 and so is newer than the Treasury curve. Even with fewer data points, we can see that the pattern of inversion-to-normalization is repeated in the 2s10s swap curve. Inversions in this curve also look fairly accurate in predicting the four recessions since its inception. In the chart below, the black line shows recessions superimposed over the 2s10s swap curve. Significant drops in the swaps curve preceded each recession, and the swap curve steepened during each recession.
The critical question - which we can’t answer definitively - is when curve normalization will occur. But we can again look at history. This current 2s10s inversion began in March 2022 and has lasted 304 trading days. That is more than 3X longer than the next most extended swaps curve inversion back in 1988-89.
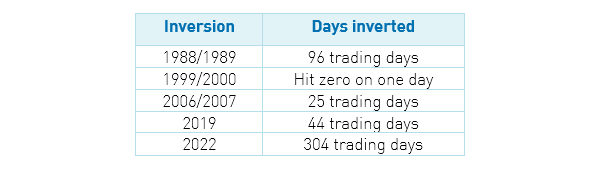
One of the difficulties in making a timing prediction is that this current inversion is so much longer and deeper than anything we’ve ever seen. There isn’t anything like it in the data. It is a bit frightening in that way. And since the yield curve historically has been mean-reverting, we tend to think that we may be in for the “mother of all steepenings” when it does come. In addition to the inverted curve, we are also paying close attention to the returns offered by Treasury Inflation-Protected Securities (TIPS). TIPS pay a variable return linked to CPI, and that return has risen recently to levels we now consider attractive. 5 Year TIPS now have a yield beyond inflation of about 2%. This is the highest spread in the last ten years and significantly above the average of the last 20 years (0.38%). It could be an opportune time to lock in historically attractive levels above CPI. The inflation level priced into TIPS is barely above the Fed’s 2% inflation target – 10-year inflation breakeven is around 2.38%.
This is where the Quadratic Interest Rate Volatility and Inflation Hedge ETF (Ticker: IVOL) comes in and how investors can potentially benefit from a normalization of the yield curve and/or the more attractive yields offered by TIPS.
For a glossary of terms, please click here.
Additionally, IVOL has paid a steady distribution of at least 30 bps every month for over four years in a row. Many of our shareholders use IVOL as a spread and return product which doesn’t require them to load up on credit risk. For IVOL’s standard performance and 30-day SEC yield, please click here.