The latest news and research from our partners. Subscribe to our mailing list for more.

April 21, 2025 – Bloomberg Markets: The Close – Nancy Davis Talks Volatility and IVOL

October 23, 2024 – Owning Inflation with Nancy Davis

April 20, 2023 – Before SVB Collapse, Nancy Davis Warned of “Short Fixed-Income Volatility Exposure” on CNBC

April 3, 2023 – Has the US Fed Put Inflation Aside to Focus on the Banking Crisis?
KFA Funds is a premier platform for developing and delivering differentiated, high-conviction investment strategies to global investors. Our newsletter is a collaboration between our internal research department and our distinguished partners. Together we strive to offer differentiated perspectives on high-conviction investment strategies and themes.
280 Park Avenue, 32nd Floor
New York, NY 10017
155 Sansome Street, Suite 400
San Francisco, CA 94104
181 Queen Victoria Street
London EC4V 4EG
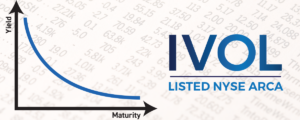
IVOL is a first-of-its-kind ETF which is designed to hedge the risk of an increase in fixed income volatility and/or an increase in inflation expectations. It also seeks to profit from a steepening of the yield curve, whether that occurs via rising long-term interest rates or falling short term interest rates, which are historically associated with large equity market declines.
What makes IVOL unique is that it is long interest rate volatility via its access to the OTC fixed income options market. No other active or passive ETF has provided its investors access to this market before. This access is the key to IVOL’s many applications and allows it to potentially benefit from normalization of the yield curve while seeking to provide inflation-protection.
IVOL also provides inflation-protected income.
| 30-day SEC Yield | 2.35% |
30-day SEC Yield (Subsidized/Unsubsidized) is a standard yield calculation developed by the U.S. Securities and Exchange Commission (SEC) that allows for fairer comparisons of bond funds. It is based on the most recent 30-day period covered by the fund's filings with the SEC. It includes any TIPS principal adjustment from inflation as income. An exceptionally high 30-day SEC yield may be attributable to a rise in the inflation rate, which may not be repeated. Unsubsidized yield does not adjust for any fee waivers and/or expense reimbursements in effect.
| Ticker | IVOL |
| Primary Exchange | NYSE |
| CUSIP | 500767736 |
| ISIN | US5007677363 |
| Net Assets | $343,853,997 |
| Shares Outstanding | 17,700,002 |
| Total Annual Fund Operating Expense | 1.02% |
| Inception Date | 5/13/2019 |
| Distribution Frequency | Monthly |
| Performance Benchmark | Bloomberg US Treasury Inflation-Linked Bond Index |
| Management Style | Active |
| Monthly Historical Distribution (Minimum) | 0.30% |
| Daily Net Asset Value (NAV) and Market Price | |
| NAV | $19.43 |
| NAV Daily Change | 0.21% |
| Market Price | $19.42 |
| Market Price Daily Change | -0.56% |
| 30 Day Median Bid/Ask Spread |
0.05% |
|
Curve Spread DV01 Data as of 07/02/2025 |
$0.0491 |
| Curve Spread DV01 is the sensitivity of the fund’s OTC options to a 0.01% change in the steepness of the US interest rate curve. | |
| The ETF’s 30 Day Median Bid-Ask Spread is calculated by identifying the ETF’s national best bid and national best offer ("NBBO") as of the end of each 10 second interval during each trading day of the last 30 calendar days and dividing the difference between each such bid and offer by the midpoint of the NBBO. The median of those values is identified and that value is expressed as a percentage rounded to the nearest hundredth. | |
| NAV | Market Price | Premium/Discount |
| $19.43 | $19.42 | $-0.01 |
| 2024 Full Year | Q1 2025 | Q2 2025 | Q3 2025 | |
| Days traded at premium | 124 | 56 | 33 | 1 |
| Days traded at NAV | 0 | 0 | 0 | 0 |
| Days traded at discount | 128 | 64 | 29 | 1 |
The Premium/Discount History chart demonstrates the difference between the daily market price of shares of the Fund and the Fund’s net asset value (NAV). The vertical axis of the chart shows the premium or discount of the daily market price as a percentage of the NAV. The horizontal axis shows each trading day in the time period, and each data point in the chart represents the Premium/Discount on that day. The data presented in the chart and table above represent past performance and cannot be used to predict future results.
| Fund NAV | Closing Price | Bloomberg US Treasury Inflation-Linked Bond Index | |
| 1 Month | 0.40% | 0.25% | 0.95% |
| 3 Month | 5.72% | 5.66% | 0.48% |
| 6 Month | 12.08% | 12.26% | 4.67% |
| YTD | 12.08% | 12.26% | 4.67% |
| Since Inception | -2.57% | -2.53% | 19.98% |
| Fund NAV | Closing Price | Bloomberg US Treasury Inflation-Linked Bond Index | |
| 1 Year | 9.55% | 9.55% | 5.84% |
| 3 Year | -4.97% | -4.90% | 2.34% |
| 5 Year | -2.72% | -2.87% | 1.61% |
| Since Inception | -0.42% | -0.42% | 3.01% |
Bloomberg US Treasury Inflation-Linked Bond Index (Total Return USD Unhedged): Measures the performance of the US Treasury Inflation Protected Securities (TIPS) market. The US TIPS Index is a subset and the largest component of the Global Inflation-Linked Bond Index. (Note: Federal Reserve holdings of US TIPS are not index eligible and are excluded from the face amount outstanding of each bond in the index). The Index was launched April 1998, with history back to March 1, 1997.
The performance data quoted represents past performance. Past performance does not guarantee future results. The investment return and principal value of an investment will fluctuate so that an investor's shares, when sold or redeemed, may be worth more or less than their original cost and current performance may be lower or higher than the performance quoted.
| 2025 Distributions and Calendar |
| Ex-Date | Record Date | Payable Date | Amount |
| 01/30/2025 | 01/30/2025 | 01/31/2025 | 0.053501 |
| 02/27/2025 | 02/27/2025 | 02/28/2025 | 0.053895 |
| 03/28/2025 | 03/28/2025 | 03/31/2025 | 0.055914 |
| 04/29/2025 | 04/29/2025 | 04/30/2025 | 0.059548 |
| 05/29/2025 | 05/29/2025 | 05/30/2025 | 0.058066 |
| 06/27/2025 | 06/27/2025 | 06/30/2025 | 0.059030 |
| 07/30/2025 | 07/30/2025 | 07/31/2025 | |
| 08/28/2025 | 08/28/2025 | 08/29/2025 | |
| 09/29/2025 | 09/29/2025 | 09/30/2025 | |
| 10/30/2025 | 10/30/2025 | 10/31/2025 | |
| 11/26/2025 | 11/26/2025 | 11/28/2025 | |
| 12/30/2025 | 12/30/2025 | 12/31/2025 |
Future calendar dates are subject to change. There is no guarantee that dividends will be paid. Past distributions are not indicative of future trends. This material is provided for educational purposes only and does not constitute investment advice.
Distributions are issued to brokers on the payable date, and are subject to broker payment schedules.
| 2024 Distributions |
| Ex-Date | Record Date | Payable Date | Amount |
| 01/29/2024 | 01/30/2024 | 01/31/2024 | 0.061293 |
| 02/27/2024 | 02/28/2024 | 02/29/2024 | 0.058391 |
| 03/26/2024 | 03/27/2024 | 03/28/2024 | 0.057607 |
| 04/26/2024 | 04/29/2024 | 04/30/2024 | 0.055745 |
| 05/30/2024 | 05/30/2024 | 05/31/2024 | 0.055008 |
| 06/27/2024 | 06/27/2024 | 06/28/2024 | 0.055384 |
| 07/30/2024 | 07/30/2024 | 07/31/2024 | 0.056873 |
| 08/29/2024 | 08/29/2024 | 08/30/2024 | 0.058347 |
| 09/27/2024 | 09/27/2024 | 09/30/2024 | 0.058045 |
| 10/30/2024 | 10/30/2024 | 10/31/2024 | 0.055825 |
| 11/27/2024 | 11/27/2024 | 11/29/2024 | 0.053625 |
| 12/30/2024 | 12/30/2024 | 12/31/2024 | 0.053202 |
| 2023 Distributions |
| Ex-Date | Record Date | Payable Date | Amount |
| 01/27/2023 | 01/30/2023 | 01/31/2023 | 0.067006 |
| 02/24/2023 | 02/27/2023 | 02/28/2023 | 0.063678 |
| 03/29/2023 | 03/30/2023 | 03/31/2023 | 0.068946 |
| 04/26/2023 | 04/27/2023 | 04/28/2023 | 0.071330 |
| 05/26/2023 | 05/30/2023 | 05/31/2023 | 0.067176 |
| 06/28/2023 | 06/29/2023 | 06/30/2023 | 0.062450 |
| 07/27/2023 | 07/28/2023 | 07/31/2023 | 0.062034 |
| 08/29/2023 | 08/30/2023 | 08/31/2023 | 0.061252 |
| 09/27/2023 | 09/28/2023 | 09/29/2023 | 0.061250 |
| 10/27/2023 | 10/30/2023 | 10/31/2023 | 0.062989 |
| 11/28/2023 | 11/29/2023 | 11/30/2023 | 0.061068 |
| 12/27/2023 | 12/28/2023 | 12/29/2023 | 0.061932 |
| 2022 Distributions |
| Ex-Date | Record Date | Payable Date | Amount |
| 01/27/2022 | 01/28/2022 | 01/31/2022 | 0.078293 |
| 02/24/2022 | 02/25/2022 | 02/28/2022 | 0.078043 |
| 03/29/2022 | 03/30/2022 | 03/31/2022 | 0.077769 |
| 04/27/2022 | 04/28/2022 | 04/29/2022 | 0.077355 |
| 05/26/2022 | 05/27/2022 | 05/31/2022 | 0.077099 |
| 06/28/2022 | 06/29/2022 | 06/30/2022 | 0.076566 |
| 07/27/2022 | 07/28/2022 | 07/29/2022 | 0.076400 |
| 08/29/2022 | 08/26/2022 | 08/31/2022 | 0.072270 |
| 09/28/2022 | 09/29/2022 | 09/30/2022 | 0.067379 |
| 10/27/2022 | 10/28/2022 | 10/31/2022 | 0.067992 |
| 11/28/2022 | 11/29/2022 | 11/30/2022 | 0.067840 |
| 12/28/2022 | 12/29/2022 | 12/30/2022 | 0.068175 |
| 2021 Distributions |
| Ex-Date | Record Date | Payable Date | Amount |
| 01/27/2021 | 01/28/2021 | 01/29/2021 | 0.085016 |
| 02/24/2021 | 02/25/2021 | 02/26/2021 | 0.086360 |
| 03/29/2021 | 03/30/2021 | 03/31/2021 | 0.086199 |
| 04/28/2021 | 04/29/2021 | 04/30/2021 | 0.085347 |
| 05/26/2021 | 05/27/2021 | 05/28/2021 | 0.086243 |
| 06/28/2021 | 06/29/2021 | 06/30/2021 | 0.083414 |
| 07/28/2021 | 07/29/2021 | 07/30/2021 | 0.084660 |
| 08/27/2021 | 08/30/2021 | 08/31/2021 | 0.083645 |
| 09/28/2021 | 09/29/2021 | 09/30/2021 | 0.083150 |
| 10/27/2021 | 10/28/2021 | 10/29/2021 | 0.083365 |
| 11/26/2021 | 11/29/2021 | 11/30/2021 | 0.081592 |
| 12/29/2021 | 12/30/2021 | 12/31/2021 | 0.126905 |
| 2020 Distributions |
| Ex-Date | Record Date | Payable Date | Amount |
| 01/29/2020 | 01/30/2020 | 01/31/2020 | 0.075724 |
| 02/26/2020 | 02/27/2020 | 02/28/2020 | 0.076128 |
| 03/27/2020 | 03/30/2020 | 03/31/2020 | 0.078542 |
| 04/28/2020 | 04/29/2020 | 04/30/2020 | 0.079430 |
| 05/27/2020 | 05/28/2020 | 05/29/2020 | 0.079475 |
| 06/26/2020 | 06/29/2020 | 06/30/2020 | 0.081006 |
| 07/29/2020 | 07/30/2020 | 07/31/2020 | 0.080821 |
| 08/27/2020 | 08/28/2020 | 08/31/2020 | 0.082363 |
| 09/28/2020 | 09/29/2020 | 09/30/2020 | 0.081847 |
| 10/28/2020 | 10/29/2020 | 10/30/2020 | 0.082285 |
| 11/25/2020 | 11/27/2020 | 11/30/2020 | 0.081926 |
| 12/29/2020 | 12/30/2020 | 12/31/2020 | 0.084020 |
| 2019 Distributions |
| Ex-Date | Record Date | Payable Date | Amount |
| 07/29/2019 | 07/30/2019 | 07/31/2019 | 0.077430 |
| 08/28/2019 | 08/29/2019 | 08/30/2019 | 0.077521 |
| 09/26/2019 | 09/27/2019 | 09/30/2019 | 0.076560 |
| 10/29/2019 | 10/30/2019 | 10/31/2019 | 0.075992 |
| 11/26/2019 | 11/27/2019 | 11/29/2019 | 0.075710 |
| 12/27/2019 | 12/30/2019 | 12/31/2019 | 0.128170 |


The Growth of $10,000 chart reflects an initial investment of $10,000 on the day prior to the selected time period and assumes reinvestment of dividends and capital gains. For the growth of $10,000 chart since inception, the initial investment of $10,000 is instead made on the inception date of the Fund. Fund expenses, including management fees and other expenses were deducted. The growth of a $10,000 investment in the fund is hypothetical and for illustration purposes only. Fund performance data used in this chart is based on Fund NAV and represents past performance. Past performance does not guarantee future results.
| Rank | Name | % of Net Assets | Ticker | Identifier | Type | Shares Held | Market Value($) |
| 1 | SCHWAB U.S. TIPS ETF | 68.71% | SCHP | US8085248701 | Mutual Fund | 8,862,914 | 234,955,850 |
| 2 | Cash | 15.15% | – | – | Cash | 51,823,258 | 51,823,258 |
| 3 | USD CMS 2-10 04/14/27 20 | 4.44% | – | – | Option | 300,000 | 15,179,335 |
| 4 | USD CMS 2-10 04/08/2026 5 | 3.28% | – | – | Option | 225,000 | 11,224,796 |
| 5 | USD CMS 2-10 12/09/26 28 | 2.55% | – | – | Option | 200,000 | 8,722,818 |
| 6 | USD CMS 2-10 09/15/27 50 | 2.54% | – | – | Option | 250,000 | 8,689,865 |
| 7 | USD CMS 2-10 01/28/2026 3 | 1.64% | – | – | Option | 125,000 | 5,618,493 |
| 8 | USD CMS 2-10 05/17/28 55 | 0.99% | – | – | Option | 100,000 | 3,378,011 |
| 9 | USD CMS 2-10 09/17/25 08 | 0.69% | – | – | Option | 100,000 | 2,376,011 |
Holdings are subject to change.
Hyperlinks on this website are provided as a convenience and we disclaim any responsibility for information, services or products found on the websites linked hereto.
Click here to continueYou are now leaving KFAFunds.com. Hyperlinks on these websites are provided as a convenience and we disclaim any responsibility for information, services or products found on the websites linked hereto.
This website uses cookies to help us enhance your browsing experience. By using this website you consent to our use of these cookies. You can customize your preferences by clicking “Cookie Preferences” below. To find out more about how we use cookies and how to manage them, please see our Terms & Conditions and Privacy Policy.