


Mean Reversion: A Role for IVOL
The Quadratic Interest Rate Volatility and Inflation Hedge ETF (Ticker: IVOL) delivered a strong performance in the first half of 2025, as the US interest rate curve began to normalize. This steepening of the spot and forward 2s10s curves has caused IVOL to outperform in the first half of the year: IVOL +12.26%. After posting strong returns during the tariff announcement selloff, IVOL has continued to perform well as the equity markets recovered and rallied. Many other investments that performed well during the selloff then struggled when markets rallied.
For IVOL’s standard performance and 30 day SEC yield, please click here.
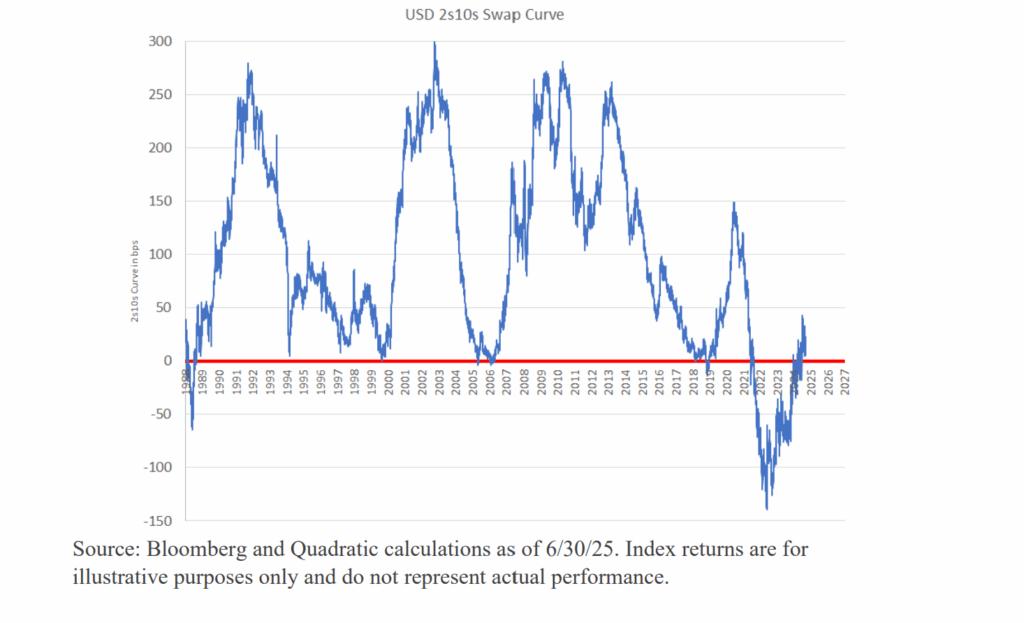
IVOL’s recent outperformance is largely due to the beginning of the normalization of the yield curve. While the curve has finally resumed its usual, upward-sloping shape, we remain far from the historical average and even farther from historical highs. The chart below is particularly telling and gives some idea of the scale of the moves we have seen this year. In the chart, the horizontal red line is set at zero, meaning zero difference between 2 year and 10 year swap rates. The further from zero, the greater the steepness or inversion of the curve on that date. The swap curve only began in 1988, so the chart encompasses the full time series. From the chart, a few observations are very clear.
The performance data quoted represents past performance. Past performance does not guarantee future results. The investment return and principal value of an investment will fluctuate so that an investor's shares, when sold or redeemed, may be worth more or less than their original cost and current performance may be lower or higher than the performance quoted. For performance data current to the most recent month end, please visit www.kfafunds.com/etf/ivol.
First, note that the current steepness of the curve is nowhere near the historical average of roughly 100 bps. Second, we can see that the swap curve historically has been mean-reverting. Each previous inversion (in 1989, 2001, 2007 and 2019) has been followed by significant steepening. Given that the most recent inversion is both the deepest and the longest lasting, one may wonder what sort of steepening we will see.
As a reference, the spot 2s10s swaps curve is currently positive only by 20bps and it has been about 3 months since the 2s10s curve was last inverted.
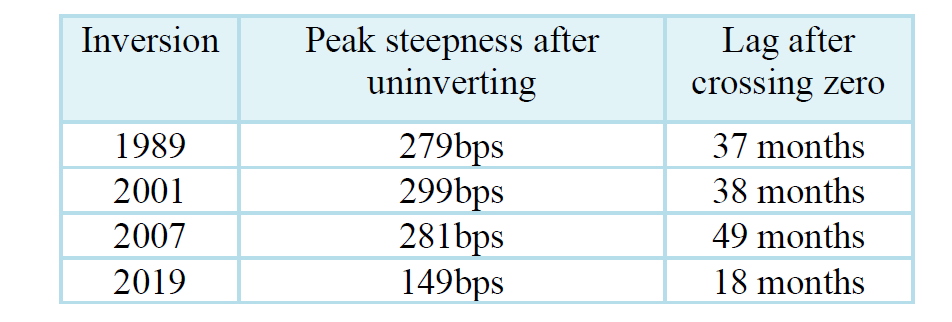
This pattern has held up well over the recent inversions: (1) Yield curve uninverts. (2) Curve steepens to at least 149bps, and as high as 299bps.
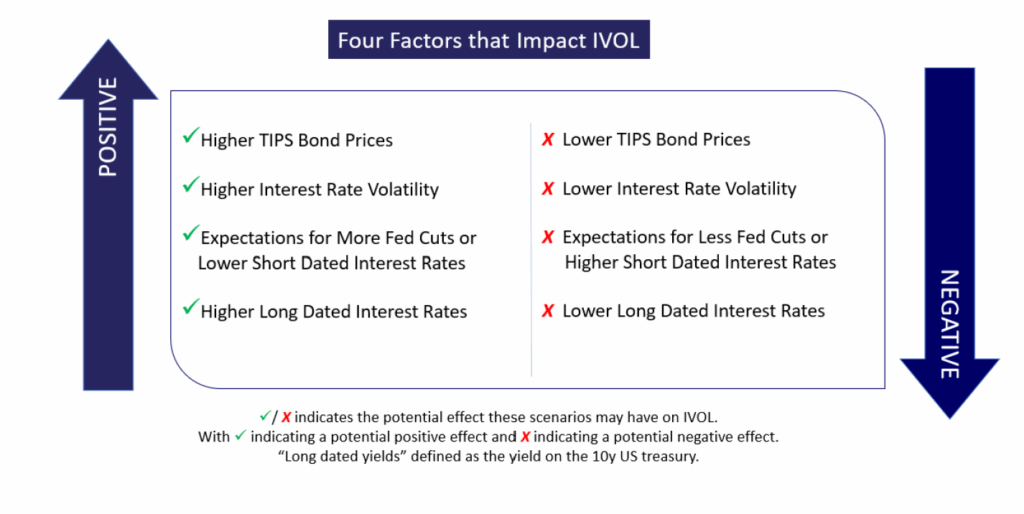
With the yield curve resuming its normal shape, we believe similar factors are in place to support IVOL’s continued outperformance:
Specifically, we are also paying close attention to the returns offered by Treasury Inflation-Protected Securities (TIPS). TIPS pay a variable return linked to CPI, and that return has risen recently to levels we now consider attractive. Five Year TIPS now have a yield beyond inflation of about 1.57%. This is close to the highs over the last 10 years, and significantly above the average of the last 10 years (0.36%). It could be an opportune time to lock in historically attractive levels above CPI. The inflation level priced into TIPS is barely above the Fed’s 2% inflation target. Five year inflation breakeven is now around 2.42%.
IVOL provides a tool to potentially help investors benefit from a normalization of the yield curve and/or the more attractive yields offered by TIPS.
Additionally, IVOL has paid a steady distribution of at least 30 bps every month for over 5 years in a row. Many of our shareholders use IVOL as a spread and return product which doesn’t require them to load up on credit risk.
This material contains the Nancy Davis’ opinion and should not be regarded as investment advice or recommendation of any specific securities or investment.