


Unleashing Potential From Low Expectations for the Curve and Volatility: Why 2025 Has Us Excited for IVOL
In the rates market, the start of 2025 could not be more different than the start of 2024.
Last January, the forward curve was expected to steepen, meaning the curve was priced to be higher in the future. Instead, the curve steepened far less than expected and flattened the forwards. For instance, the 18 month forward fell by over 50% in 2024 from 22bps to 10bps.
As we start 2025, there is no steepening priced in going all the way out to 5 years: The 2s10s Treasury spot curve is 35bps. The swaps 2s10s forward is priced at 8-10bps all the way out to 2030.
In 2024, the interest rate volatility inside IVOL fell by 25%. Volatility is a measure of how expensive options are in the markets. As uncertainty increases, the price of options and implied volatility tend to increase. When volatility is low, one can buy a larger quantity of options with the same dollar amount.
Given the low starting point for the curve and volatility, this is the most excited that we have been about IVOL’s asymmetric upside potential since IVOL listed in 2019. We believe that going into 2025 IVOL offers attractive asymmetric risk/reward potential.
For financial professionals interested in learning more about IVOL we have a full white paper that describes the strategy here.
Is “Normal” Coming?
Remember the old days, when investors expected a higher return for money lent out for longer? When increased government deficits meant investors demanded a higher return for the risk they were taking? When a middle-class family could afford a house? Just a few years ago, all those things were unremarkably normal.
It seems reasonable to expect investors to want to be paid more if they lend out their money for longer. We remain puzzled that the market seems to accept that the Fed has “won” its fight against inflation and are not requiring more term premium in Treasuries to take the inflation risk.
In fact, it is hard to see why the market retains much confidence in the Fed at all. It was wrong on inflation being “transient.” It waited far too long to begin hiking. It declared victory over inflation too soon. (Even today, inflation has yet to print even one time anywhere near the Fed’s preferred 2% level.) The Fed cut rates dramatically by 50 bps in September, the first cut of that size since ’08, besides the COVID pandemic. Just three months later, these same policy makers were warning that further rate cuts were going to be a long time coming. It’s hard to point to recent Fed successes. If Jerome Powell was an SEC football coach, boosters would have long ago bought out his contract and flown Lane Kiffin in for an interview.
Treasury Secretary nominee Scott Bessent has been particularly unimpressed with Powell’s performance. Bessent told Bloomberg, “If you were concerned about the integrity of the institution, you would not have done it…Tell me on what planet is it conceivable that waiting two months is make or break, versus the integrity of the institution?” after the Fed’s initial 50 bps cut.
Bessent seems prepared to do more than question the Fed’s decisions. After Powell indicated publicly that he had no plans to resign prior to his term’s expiry in May 2026, Bessent raised the prospect of a “shadow Fed Chair.” This position would have no authority under the law, but, as Powell’s designated successor, would likely enjoy a “bully pulpit” from which to discuss future policy. If the shadow chair’s statements or outlooks contradicted Powell’s, how would markets react?
All this is to say that it seems odd to see interest rate markets so relaxed, and volatility so low. The Trump administration has promised major changes to domestic issues and foreign trade policy. It intends to extend the 2017 tax cuts into the future. The Treasury Secretary is publicly and openly underwhelmed by the Central Bank Chairman. Under such conditions, it is hard to imagine a scenario in which interest rate volatility – the market’s perception of uncertainty about interest rates – would not rise. And, historically, volatility in the rate market has not been kind to risk assets. What is a prudent investor to do?
IVOL’s Role in a Portfolio
Investors may want to consider allocations to investments which are designed to benefit from increases in volatility or a return to a normalized, upward-sloping interest rate curve. IVOL is just such a fund. We believe that IVOL has the potential to work well in several different scenarios. Historically, it has paid out monthly distributions, while providing a low correlation with other traditional asset classes. IVOL presents a value play and/or a potential hedge against market volatility. Here are some of the ways we have seen IVOL being used:
- As a Completion for the AGG (Bloomberg US Agg Index)
The Bloomberg Aggregate Bond Index has two important issues, and IVOL may potentially help investors in addressing them.
First, the AGG includes no TIPS, so investors who rely on funds benchmarked to the AGG for the totality of their fixed income exposure have no inflation protected bonds.
Second, the AGG is short fixed income optionality due to its large mortgage exposure. Homeowners are long the option to prepay, leaving mortgage investors short options. Investors in the AGG must either be comfortable with being short fixed income optionality, or they need to take action to reduce this potential threat to their portfolios.
IVOL is long fixed income volatility. So when volatility rises in the rates markets in response to market jitters or sell-offs, the long vol position inherent in IVOL may help offset the losses to the AGG caused by its potential short vol exposure.
IVOL ETF can be used as a complement to a regular fixed income portfolio.
- Replacement for TIPS. The only inflation exposure within TIPS is to the Consumer Price Index (CPI). There’s nothing intrinsically wrong with TIPS, but they only provide exposure to a narrow measure of inflation. Some investors believe that CPI is not the best or the most relevant measure of inflation. Through its long options, IVOL provides another measure of inflation beyond just the Consumer Price Index.
The Quadratic Interest Rate and Volatility Inflation Hedge ETF (NYSE ticker: IVOL) is an inflation-protected bond fund that tries to fix the problems inherent in TIPS (Treasury IVOL is rooted in the basics. Roughly 80% of the fund is TIPS (US Treasury Bonds that reset with the Consumer Price Index, CPI).
TIPS give investors the return of inflation plus a real yield. So a TIPS investor is seeking to buy TIPS with the real yield as high as possible so as to lock in a return above and beyond inflation. Now with 10y real yields close to 2.2%, this is significantly higher than the last average over the last decade of 0.5% and even over the average of the last twenty years of 0.83%. IVOL invests about 80% of its assets in TIPS, so the entry level appears attractive for long-term investors seeking to lock in a historically attractive real yield.
The balance of the IVOL portfolio is comprised of fully funded, long fixed-income options and cash. IVOL is an inflation-protected bond fund that tries to fix the problems inherent in TIPS. The problems that IVOL seeks to solve are:
- The only index of inflation used by TIPS is the Consumer Price Index (CPI). Even the Fed does not use CPI as its primary gauge for inflation. Roughly one third of the entire index is rent. IVOL provides investors another way potentially to profit from inflation that isn’t captured by the CPI index.
- All TIPS are long duration. Even “short duration” TIPS are still long duration. This means that all TIPS fall in price when real interest rates move higher. IVOL seeks to solve the duration issue with TIPS alone by benefiting rising inflation expectations, a steepening yield curve and increases in volatility.
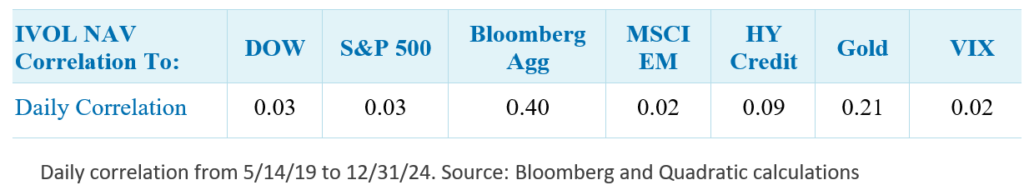
- Diversification. IVOL has shown very low correlations with most other asset classes. This may be helpful for portfolios that aren’t performing as expected. The AGG and US equities both sold off in 2022 and rose together in 2023 and 2024. Investors may be looking for less correlated holdings. Many investors seeking to reduce the overall volatility of their portfolio through diversification should consider IVOL’s low correlations with other traditional asset classes.*
If we take away anything from 2024, it should be the lesson that just because everyone expects a particular outcome doesn’t make that outcome certain. Investors looking to allocate to funds that have the potential to do well in several different conditions may want to consider whether there is a place for IVOL in their portfolios.
*Diversification does not ensure a profit or guarantee against a loss.
Index Definitions:
The Dow Jones Industrial Average (“Dow”) is an index that tracks 30 large, publicly-owned companies trading on the New York Stock Exchange and the NASDAQ.
The S&P 500, (“S&P”), is a stock market index that measures the stock performance of 500 large companies listed on stock exchanges in the US.
Bloomberg US Aggregate Bond Index (“Agg”) is a broad-based benchmark that measures the investment grade, US dollar-denominated, fixed-rate taxable bond market. The index includes
Treasuries, government-related and corporate securities, MBS (agency fixed-rate pass-throughs), ABS and CMBS (agency and non-agency).
The MSCI Emerging Markets (“MSCI EM”) Index captures large and mid cap representation across 26 Emerging Markets (EM) countries.
The iBoxx iShares High Yield Corporate Bond Index (“HY Credit”) is designed to reflect the performance of USD denominated high yield corporate debt.
VIX is a CBOE index that represents equity volatility of 30-day expectations of the S&P 500 equity index.
The LBMA Gold Price PM USD Index ("GOLD") is an index that measures the price of gold in US dollars as set by the London Bullion Market Association (LBMA).
Term Definitions:
Asymmetric Upside Potential – A situation where an investment has a greater potential for gains than for losses. This often occurs in structured products, options strategies, or investments that benefit from specific market conditions.
Consumer Price Index (CPI) – A key economic indicator that measures the average change in prices paid by consumers for goods and services over time. It is widely used to assess inflation.
Entry Level – Refers to the point at which an investor initiates a position in a financial asset. The timing and pricing of entry levels are crucial for portfolio performance.
Forward Curve – A graph showing the market-implied future interest rates at various time horizons. It is used to anticipate rate movements and price derivatives.
Interest Rate Curve (Yield Curve) – A graphical representation of interest rates (yields) on bonds of different maturities. The shape of the curve (normal, flat, or inverted) provides insights into economic conditions and monetary policy expectations.
Interest Rate Volatility – A measure of the fluctuation in interest rates over time. High volatility can indicate uncertainty in monetary policy, economic conditions, or credit markets.
Long Duration – A fixed-income strategy that involves investing in bonds with longer maturities. These securities are more sensitive to interest rate changes and typically provide higher yields than shorter-duration bonds.
Long Fixed Income Volatility – A position that benefits from increased fluctuations in bond prices and yields. Investors may use options or derivatives to gain exposure to interest rate volatility.
Real Yields – Bond yields adjusted for inflation, providing a true measure of an investor’s return after accounting for changes in purchasing power.
Swap Spreads – The difference between the fixed rate on an interest rate swap and the yield of a Treasury bond with the same maturity. It serves as an indicator of credit risk and liquidity in the financial system.
Swaps – Financial derivatives where two parties exchange cash flows, typically involving a fixed interest rate exchanged for a floating rate. Commonly used for hedging or speculation.
2s10s (2-Year/10-Year Spread) – A measure of yield curve steepness, calculated as the difference between the yields on 10-year and 2-year U.S. Treasury bonds. A negative spread (inversion) can signal economic recession expectations.
2s20s (2-Year/20-Year Spread) – Similar to 2s10s, this spread measures the difference between the 20-year and 2-year Treasury bond yields, providing insight into long-term interest rate expectations.
Term Premium – The extra yield that investors require for holding long-term bonds instead of rolling over short-term bonds. It reflects risks such as inflation uncertainty and interest rate changes.
TIPS (Treasury Inflation-Protected Securities) – U.S. government bonds designed to protect investors from inflation. The principal value adjusts with changes in the CPI, ensuring purchasing power is maintained.
Treasury Spot Curve – A curve representing yields on zero-coupon U.S. Treasury securities at various maturities. It differs from the yield curve, as it excludes coupon payments and is used for precise discounting in bond valuation.
18-Month Forward – A projected future value for interest rates, swap rates, or bond yields, 18 months into the future, based on current market data.