


Nancy Davis: Why IVOL Is Thriving as Markets Normalize
Nancy Davis, founder and CIO of Quadratic Capital Management, believes the market is finally returning to a more normal state—and that’s exactly why the Quadratic Interest Rate Volatility and Inflation Hedge ETF's (Ticker: IVOL) is performing so well.
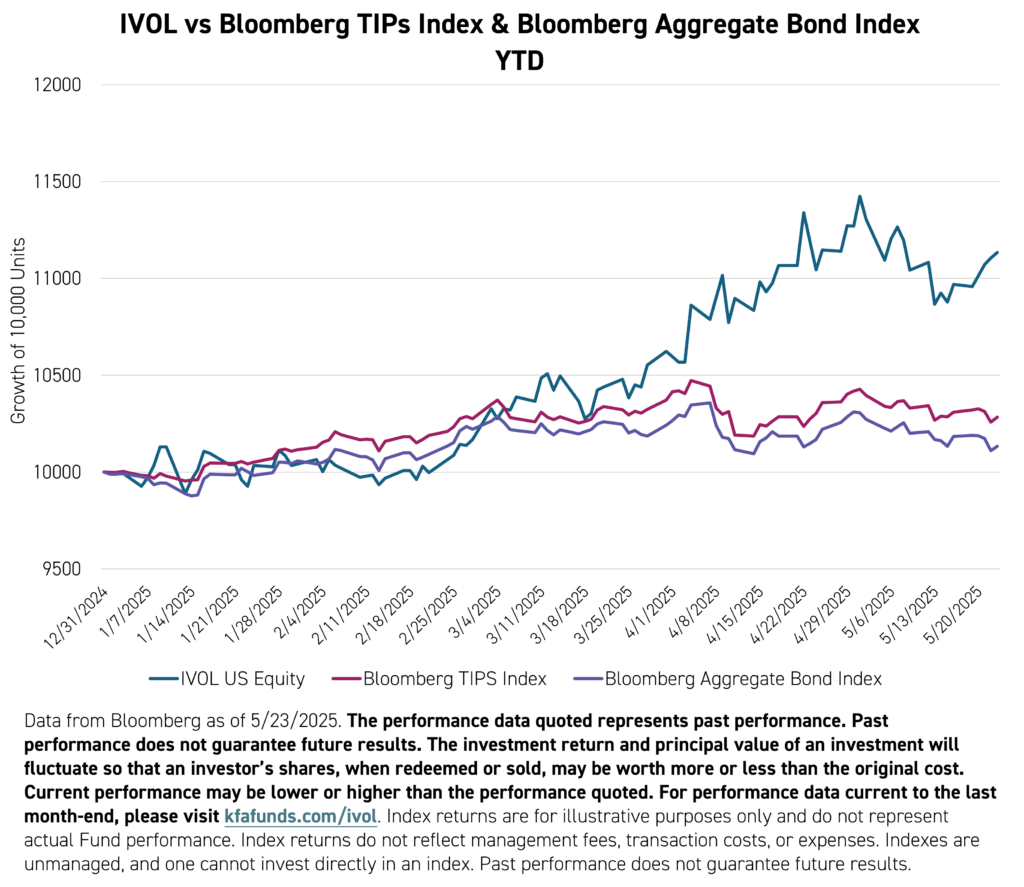
IVOL is up 11.82% YTD compared to the Bloomberg TIPS index which has returned 2.89% and the Bloomberg Aggregate Bond Index, which has returned 1.56%.1
For IVOL standard performance please click here.
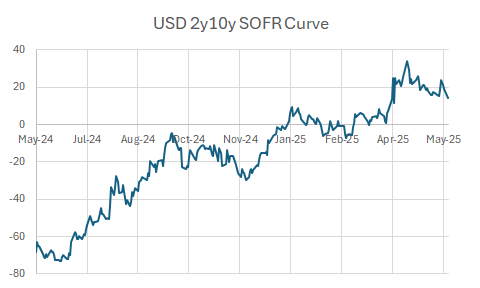
The IVOL ETF can benefit from a normalization in the interest rate markets. The shape of the interest curve only reverted to a positive slope in early 2025, after having been inverted since mid-2022. This was the longest period of inversion since 1978, when the data became available. Going forward, the curve has the potential to continue its normalization to a more normal level, which could potentially benefit IVOL. As of 5/23/25, the 2s10s SOFR spot curve was 19bps. The average since the data started is around 100bps, with a high of about 300bps.
In a recent interview, Davis argued that what some investors see as “red flags”—like rising long-term yields or a steepening yield curve—are actually just a return to market normalcy. “It’s not normal to have an inverted yield curve,” she said. “People are freaking out because things are normalizing.” According to Davis, a healthy yield curve should show higher yields for longer-dated bonds, not the inverted shape we’ve seen for the past three years. (In fact, this most recent inversion was the longest inversion of the US yield curve in history.)
That normalization of interest rates is a tailwind for IVOL, which is structured to benefit from widening interest rate spreads and increased interest rate volatility. As Davis explained, “The yield curve normalizing is what’s good for IVOL. But IVOL can also perform well if the Fed cuts more than expected or if stagflation takes hold.”
Key Takeaways:
- The yield curve is finally behaving like a yield curve again. After years of inversion, long-dated yields are rising, restoring the term premium that’s typically embedded in a healthy bond market. This steepening dynamic is core to IVOL’s strategy and has helped drive its recent outperformance.
- IVOL tends to thrive when markets diverge from consensus. Whether it's rate cuts that outpace expectations or a sudden bout of stagflation, IVOL is built to respond to surprises. Its exposure to interest rate volatility and inflation sensitivity makes it uniquely positioned to potentially benefit in a wide set of market environments.
- Traditional fixed income may leave investors exposed. Davis highlighted that core bond portfolios often lack inflation protection and are structurally short volatility due to their mortgage holdings. That means many investors are unintentionally exposed to risks — especially in today’s uncertain macro backdrop. Many investors use the IVOL ETF to complement their core fixed income holdings as the Bloomberg Agg index has no TIPS and is only short options from US mortgages (homeowners are long the option to prepay).
- Credit markets are tighter than they look. Despite narrow credit spreads in public markets, Davis pointed to growing stress in private credit and leveraged loans—sectors she calls opaque and potentially vulnerable. In her view, this reinforces the need for diversification and liquid hedging tools like the IVOL ETF.
- IVOL’s success is a reflection of normalization, not distortion. While many strategies struggle as markets pull back or flatten, IVOL has gained strength precisely because things are returning to a more textbook bond market environment. That, Davis suggests, is the kind of shift long-term investors should prepare for—not fear.
As investors seek clarity in a shifting macro landscape, Davis’ core message is simple: normalize your expectations—and consider strategies that are built to thrive when markets do just that.
For financial professionals interested in learning more about allocating to IVOL, including how to position it within a portfolio, click here to download the latest IVOL white paper.
Citations:
- Data from Bloomberg as of 5/23/25
Index Definitions:
Bloomberg U.S. Treasury Inflation-Protected Securities (TIPS) Index - measures the performance of U.S. Treasury Inflation-Protected Securities. These are government-issued bonds designed to protect investors from inflation by adjusting the principal value based on changes in the Consumer Price Index (CPI). The index includes all publicly issued TIPS that have at least one year remaining to maturity and are rated investment grade. It serves as a benchmark for investors seeking inflation-linked fixed income exposure.
Bloomberg US Aggregate Bond Index (“Agg”) - a broad-based benchmark that measures the investment grade, US dollar-denominated, fixed-rate taxable bond market. The index includes
Treasuries, government-related and corporate securities, MBS (agency fixed-rate pass-throughs), ABS and CMBS (agency and non-agency).
Term Definitions:
Interest Rate Curve (Yield Curve) – A graphical representation of interest rates (yields) on bonds of different maturities. The shape of the curve (normal, flat, or inverted) provides insights into economic conditions and monetary policy expectations.
Interest Rate Volatility – A measure of the fluctuation in interest rates over time. High volatility can indicate uncertainty in monetary policy, economic conditions, or credit markets.
2y10y SOFR curve – refers to the difference (or spread) between the 10-year and 2-year swap rates derived from the Secured Overnight Financing Rate (SOFR) interest rate swap curve. This spread is a key measure of the shape of the SOFR swap curve between the 2-year and 10-year maturities and is
TIPS (Treasury Inflation-Protected Securities) – U.S. government bonds designed to protect investors from inflation. The principal value adjusts with changes in the CPI, ensuring purchasing power is maintained.