


IVOL: A Portfolio Diversifier at a Historical Discount
Volatility in interest rates is historically low. This presents some compelling opportunities.
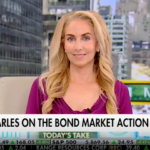
That was the clear message from Nancy Davis, founder and CIO of Quadratic Capital Management, in a recent CNBC interview. While stock market swings dominate the news, Davis pointed to a paradox unfolding in the bond market: interest rate volatility is near its lowest level in the past three years. In a market where many assets look fully valued, that stands out.
The Yield Curve Has Been Normalizing
During her CNBC interview, Davis also highlighted an opportunity in the shape of the yield curve. After enduring one of the longest inversions in modern history, the 2-year to 10-year SOFR curve turned positive at the start of 2025 and currently sits at roughly 33 basis points.1 This is well below its long-term average of nearly 100 basis points and even farther from prior-cycle peaks that reached close to 300 basis points. Please see the table below:
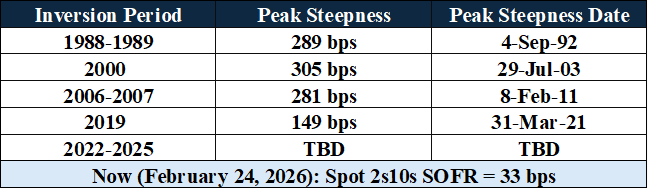
Source: Bloomberg and Quadratic calculations as of 2/24/26.
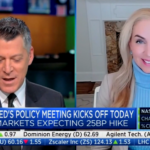
At the same time that the curve has been normalizing, market expectations for Federal Reserve rate cuts have swung dramatically. Per Bloomberg’s World Interest Rate Probability function, at the start of 2024, investors were pricing in six cuts over the next year. Today, between 2 and 3 cuts are expected over the next 2 years. That leaves a lot of room for policy surprises.
Davis pointed out that if either the Federal Reserve cuts more than expected or long-term yields rise, further normalization of the yield curve could create opportunities. “There are not a lot of places of value out there in the market,” she said.
IVOL’s Role as a Portfolio Diversifier in 2025
This theme was central to Davis’ 2025 year-end letter for IVOL.
IVOL's market price finished 2025 up +11.97%. The shape of the interest curve only reverted to a positive slope in 2025, after having been inverted since mid-2022. This was the longest period of inversion since the data became available.
For IVOL’s standard performance and 30-day SEC yield, please click here.
Just as importantly, IVOL continued to demonstrate differentiated performance across asset classes. In 2025, IVOL showed a -0.50 correlation to the S&P 500 Index and only a 0.23 correlation to the Bloomberg U.S. Aggregate Bond Index.1
That effect as a potential diversifier was especially evident during equity drawdowns. During the seven weeks around the “Liberation Day” selloff, when the S&P 500 declined by -18.90%, IVOL's market price gained +10.92%, while the Aggregate Bond Index rose just +1.03%.2 In a year marked by trade tensions, shifting monetary policy expectations, and uneven economic growth, IVOL worked as designed: as a complement to traditional stock-and-bond allocations.
Importantly, IVOL has also paid a steady distribution of at least 30 basis points every month for more than six consecutive years, offering investors a spread and return profile without adding corporate credit risk, an attractive feature when credit spreads are near their tights.*
A Constructive Case for Diversification
Davis' message is not that equities cannot move higher. Instead, portfolios may benefit from thoughtful diversification at a time when traditional assets are richly valued, and policy expectations are narrow.
Volatility is historically inexpensive. The yield curve has started to normalize. Credit spreads are tight. And market expectations for Fed cuts are lukewarm.
For investors seeking to potentially strengthen portfolio resilience while maintaining exposure to inflation, IVOL offers a differentiated approach, one that may benefit from curve steepening, volatility repricing, and policy surprises.
Diversification does not protect against market risk.
*Distributions are not guaranteed, may change or end in the future, and may include a return of capital.
Citations:
- Bloomberg and Quadratic calculations as of 12/31/25.
- The 7-week window around "Liberation Day" ran from 2/19/25 to 4/8/25.
Definitions:
1. S&P 500 Index: The S&P 500 is a market-capitalization-weighted index that tracks the performance of 500 of the largest publicly traded companies listed on U.S. stock exchanges, spanning all major sectors of the economy, and is widely regarded as the most representative benchmark of the U.S. large-cap equity market and a leading indicator of overall U.S. stock market performance.
2. Bloomberg U.S. Aggregate Bond Index: The Bloomberg U.S. Aggregate Bond Index is a broad-based benchmark that tracks the performance of the U.S. investment-grade bond market, including U.S. Treasuries, government-related bonds, corporate bonds, mortgage-backed securities, asset-backed securities, and commercial mortgage-backed securities, and is widely used to represent the total U.S. taxable bond market.