


Global Carbon Allowance Markets See Upside Potential

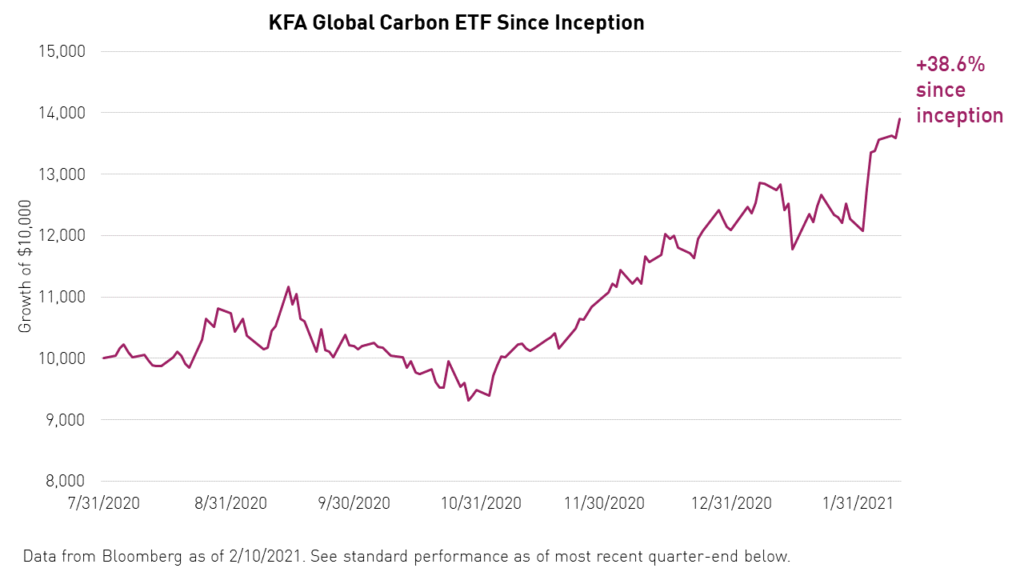
Global carbon allowance markets are off to a great start in 2021. This year, the IHS Markit Global Carbon Index is up 7% after returning over 30% in 20201. London hedge fund Andurand Capital Management has placed its target price to emit one ton of carbon in the EU at €100 by the end of 20212. Today, such emissions cost just €353. A few months ago, this target may have seemed overly bullish, but we have now entered a new era for climate policy. Governments worldwide emerged from 2020 with a renewed focus on improving the environment and reducing emissions, a potential long-term catalyst for the global carbon allowance market.
In a January 27th executive order, President Biden elevated climate change to an essential element of US foreign policy and national security and mandated that a new emissions target be set for the United States. The president also rejoined the landmark Paris Agreement on Climate Change and enacted a policy to curb fossil fuel production on his first day in office with the cancellation of the Keystone XL pipeline. The president has even created an entirely new cabinet position dedicated to climate matters and appointed former Secretary of State John Kerry, an outspoken proponent of cap-and-trade, to the post. Kerry has expressed that fulfilling US obligations under the Paris Agreement is not sufficient considering the severity of the climate crisis and that the US must go above and beyond to curb emissions.4
Even before the new administration elevated their prospects, Cap-and-trade programs in the US continued their expansion in 2020. In August, Virginia became the first southern state to join the Regional Greenhouse Gas Initiative (RGGI), the cap-and-trade program for the Eastern United States.5
Although the pandemic initially stifled demand for carbon allowances in the US, California's market for credits appears to have recovered. In a California-Quebec joint auction in May, the first following the onset of the pandemic, less than one-quarter of the credits offered were sold. However, subsequent auctions in August and November were completely soldout.6
Meanwhile, the European Union's carbon market, the most comprehensive globally by far, has continued to successfully price carbon emissions and incentivize market participants to pollute less. The average price for emitting one ton of carbon into the atmosphere in the EU area has risen to nearly €35 from a low of less than €5 in mid-2017.3 This price increase has been fueled in part by recent reforms to the emissions trading system (ETS) employed by the EU. Markets in North America also continue to price carbon higher. In the RGGI market, the price of emissions has risen to over $7 from less than $3 in mid-2017.9 In California, the price has risen to over $17 from less than $15 in 2018.6 Investors interested in a more detailed overview of recent reforms and carbon allowance mechanics can read more details in our recent white paper.
In February, China launched its highly anticipated carbon credit trading system, which is expected to become the largest carbon credit market in the world. Although credits will initially only be issued to thermal power plants, the government may include other kinds of polluters later. Nonetheless, thermal power alone makes up 40% of China's total emissions,7 produces over 6% of global greenhouse gas emissions,8 and accounts for pumping twice as much carbon into the atmosphere as the entire EU area. Already, over 2,000 entities have been registered to participate in the market.7 The establishment of China's carbon market represents a significant milestone in the global effort to price carbon and curb emissions.
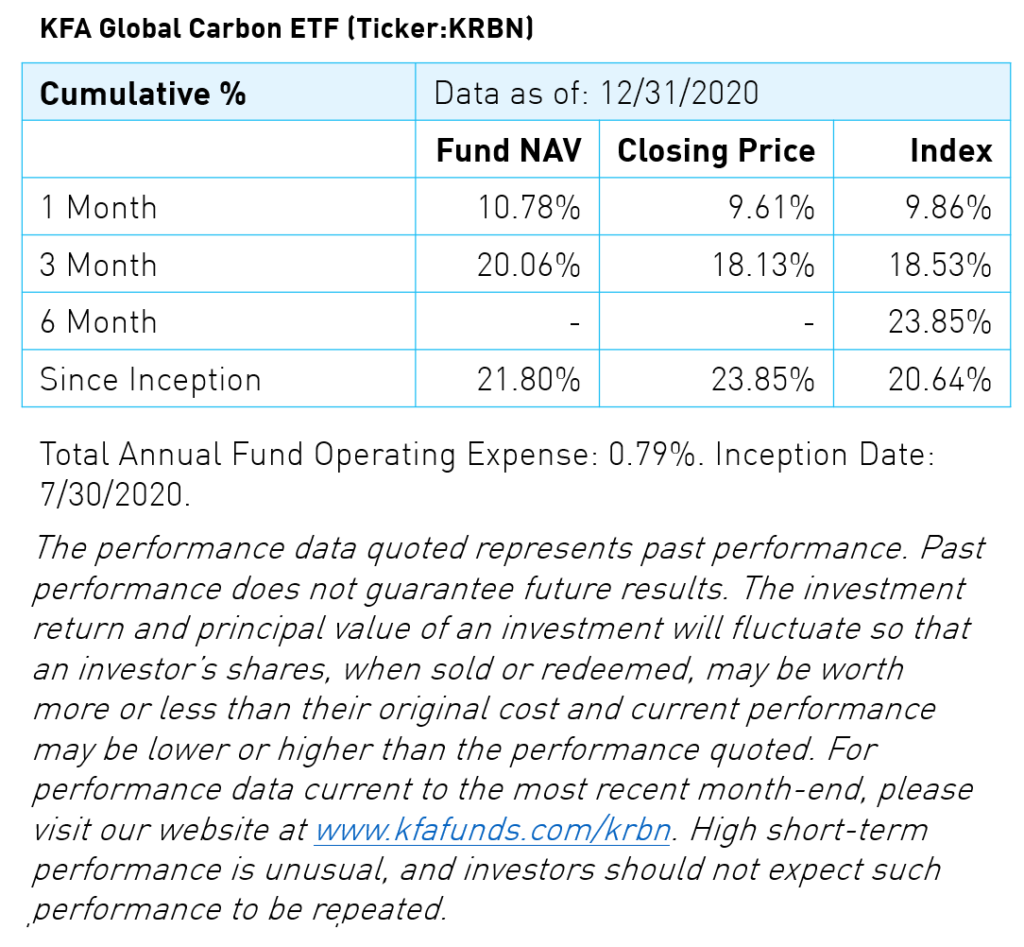
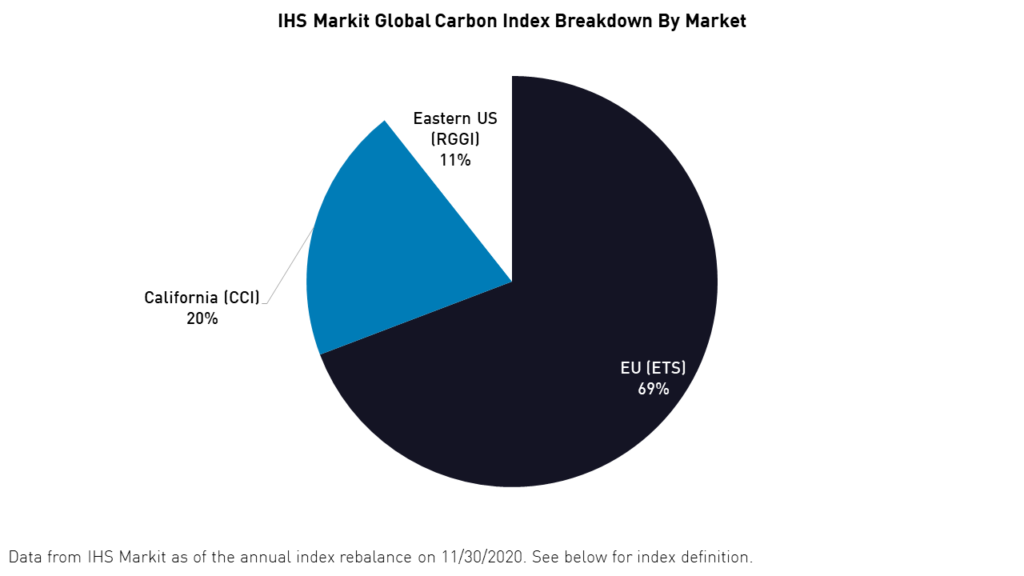
The KFA Global Carbon ETF (Ticker: KRBN) offers exposure to the three most liquid carbon emissions markets worldwide by tracking the IHS Markit Global Carbon Index. These include California Climate Investments (CCI), the Regional Greenhouse Gas Initiative (RGGI) in the Eastern US, and the EU’s Emissions Trading System (ETS). KRBN is the only US-listed carbon credit ETF to cover all three markets.
2020 concluded with a confluence of tailwinds for the expansion of the global carbon allowance market. A renewed focus on climate issues in the US, reforms to the emissions trading system in Europe, and the launch of China’s carbon market all lend themselves to long-term appreciation in the global price of carbon.
Citations
- Based on the performance of the IHS Markit Global Carbon Index. Data from Bloomberg as of 2/8/2021.
- Mathis, Will. "London Hedge Funds Are Betting a $100 Carbon Price Is Almost Here," Bloomberg. February 2, 2021.
- EU Carbon price data from EMBER as of February 1, 2021.
- Lustgarten, Abrahm. "John Kerry, Biden's Climate Czar, Talks About Saving the Planet," ProPublica. December 18, 2020.
- Cornelius, Kaylee. "Virginia Joins the Regional Greenhouse Gas Initiative," Climate X Change. August 12, 2020.
- California Air Resources Board. California Cap-and-Trade Program: Summary of California-Quebec Joint Auction Settlement Prices and Results.
- Farand, Chloe. "China launches world's largest carbon market for power sector," Climate Change News. January 1, 2021.
- World Bank State and Trends of Carbon Pricing 2020, ICAP ETS Fact Sheets.
- Source: Regional Greenhouse Gas Initiative (RGGI)
Index returns are for illustrative purposes only and do not represent actual fund performance. Indexes are unmanaged and one cannot invest directly in an index. Index returns do not reflect any management fees, transaction costs, or expenses. Past performance does not guarantee future results.
Index Definition
IHS Markit Global Carbon Index: The IHS Markit Global Carbon Index is designed to measure the performance of the global carbon credit market. Carbon credit futures are utilized to access carbon credit markets due to their liquidity and accessibility to investors. The eligible carbon credit futures for the index are selected based on the most liquid segments of the relevant markets. The index is weighted according to the trade volumes of eligible constituent programs subject to a capping methodology. Capping is applied on a regional basis with regions being defined as EMEA, Americas, and APAC, as well as on a program-level basis within each region to ensure diversification. The index was launched on July 25, 2019.