


Back To Basics: Looking Beyond The “Fab Five” For a Core High-Dividend Equity Strategy

2020 and 2021 were exceptional years in many ways. In the US stock market, a sudden and severe recession was met with spectacular gains, led by a small number of familiar high-growth companies. By the end of 2021, the market was dominated by a handful of names, a fragile situation that worries many investors. Naturally, those concerned with the arguably overvalued giants at the top of the market seek safer and sounder approaches to the market. We believe a diversified* portfolio of higher dividend stocks, such as the KFA Value Line® Dynamic Core Equity Index ETF (Ticker: KVLE), is a compelling core holding for an investor seeking a more conservative equity positioning.
This paper is in two parts. First, a discussion of the extraordinary concentration currently in the US equity market and its implications for the near future. Second, a discussion of higher dividend investing as an alternative to overly concentrated core portfolios.
Part One: The Fab Five
Over just short of three years, from the end of 2018 to December 31, 2021, the S&P has almost exactly doubled, up 100.37%. Perhaps even more impressively, and almost implausibly, it is up 52.39% since 2019, a 24-month period dominated by a global pandemic and an accompanying recession.
How the pandemic drove market returns was surprising to many of us. Instead of being inspired by caution and led by defensive sectors such as consumer staples and healthcare, as might be expected in a difficult economic environment, the market instead was dominated by a short list of very large capitalization growth stocks.
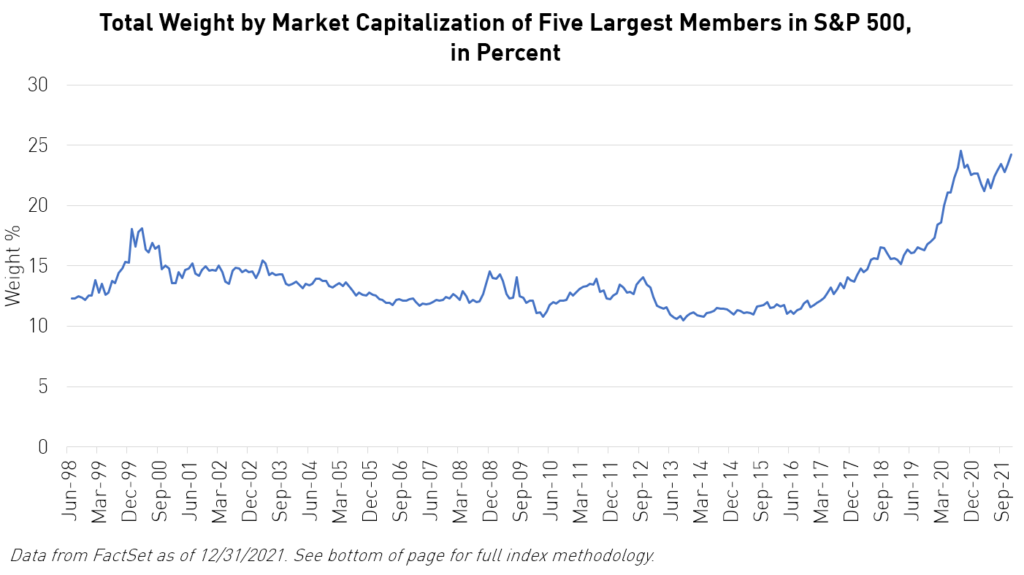
Above is the percentage of the S&P 500 accounted for by the five largest companies in the index, since January 2000. The current concentration of the S&P is not entirely unprecedented, but it is a significant departure from historical norms. Six or seven years ago, the five largest holdings accounted for about an eighth of the index. Today it is much closer to a fourth. (24.24% as of the end of December.)
And the index's top five all fall under a similar industry concentration and share strong commonalities. As recently as a bit more than a decade ago, in February 2010, the five largest companies in the index accounted for about 12% of it. They were Exxon, T-Mobile, Microsoft, Pfizer, and Wal-Mart. Each was a dominant giant in its field, but that was nearly all they had in common. A portfolio of the five would have been modestly diversified.
Today, the top five are Alphabet/Google, Amazon, Apple, Microsoft, and Tesla. A very earnest person might argue that this list is diversified, made up of an advertising company, a retailer, a maker of cell phones, a software company, and an auto manufacturer. But we know better. All five share a common theme. They are high-profile technology-oriented companies with familiar consumer products and celebrity founders. A portfolio of the five would be far from diversified.
And, of course, a portfolio of the five would have performed spectacularly well recently. It is hard to exaggerate the degree to which these few stocks have been driving the broader market. The chart below shows the S&P 500 on a total return basis for the past ten years, divided into the Top 5 largest companies and the remainder, the “S&P 495.” (The Top 5 and S&P 495 is here rebalanced monthly.)
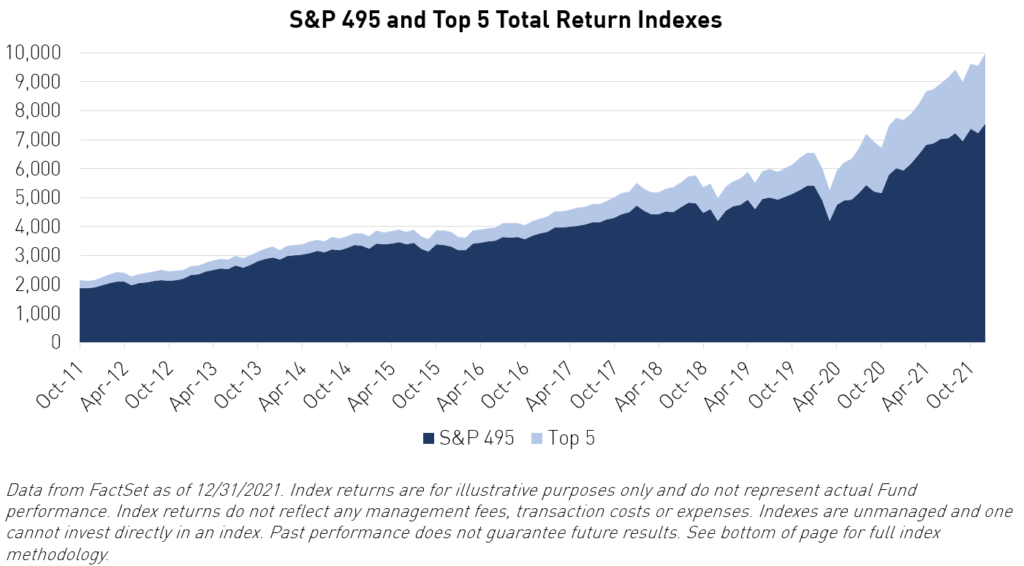
For the two-year period just ended, in which the S&P 500 gained 52.39%, the S&P 495 gained 40.61%. That is an impressive return that would satisfy most investors, but the fact remains that without just five names the S&P would have done 11.78% worse. And that accounts only for the direct effect of the Top 5. Presumably, the increasing prices of these leaders have dragged up the prices of some mere mortal stocks by comparison.
Over the same 24-month period the Top 5 was up 105.27%. The five now have a combined market capitalization of $10 Trillion and collectively made $261 Billion in profit over the twelve months ended September 30, 2021, for a price earnings multiple of 38.5.
Predicting the future is always very difficult, particularly when current circumstances are so unique. However, something similar but less extreme than this happened at the very start of this century, at the height of what was afterwards called the Dot-Com Bubble.
On March 31, 2000, near the bubble’s top, the Top 5 made up 17.83% of the S&P 500. It included Cisco, General Electric, Intel, Microsoft, and Qualcomm. That is four tech companies and a conglomerate with a then celebrity CEO and an unlikely cult following among investors.
Microsoft is still in the Top 5. And the other four? Did something terrible happen to them? GE has had some challenges recently, but the tech companies are alive and well, large, successful, and profitable. What happened was that investors gradually fell out of love with them, and their valuations came back down to Earth. This should be an object lesson for fans of our current five heroes. The danger is not that these are not excellent and well-run companies, but that the market may someday reconsider how much these excellent and well-run companies are worth.
Over the 18 months that began March 31, 2000, the S&P 500 declined -29.26%, while the Top 5 lost -40.38%. By September 2001, the Top 5 no longer included Cisco, Intel, or Qualcomm. They were replaced by Citigroup, Exxon, and Pfizer.
Part Two: Investing in Historically Higher Dividend Stocks
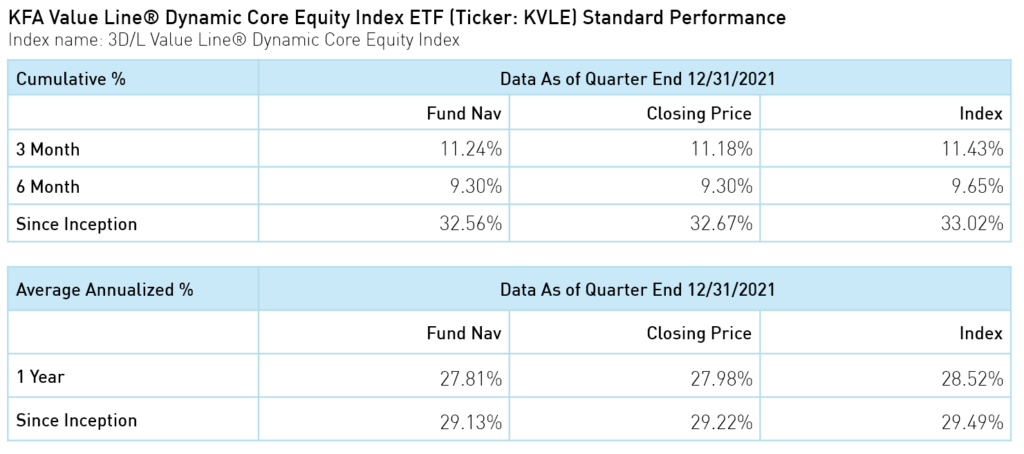
Nathan Eigerman, co-CIO at 3D/L Capital Management, the nondiscretionary sub-advisor to the KFA Value Line® Dynamic Core Equity Index ETF (Ticker: KVLE), revisited a previous whitepaper on high dividend-yielding strategies and found the updated data set continues to reinforce his thesis.
An investor wishing to become more conservative in his or her equity allocation, away from the Top 5 and towards stocks that exhibit more fundamental value, might want to consider historically higher dividend paying names.
Many investors prefer stocks with a history of paying dividends as an attractive combination of current income and growth potential. Others argue that this preference is misplaced, that the only thing that should concern investors is total return, the sum of dividends and price appreciation. Discussing the choice between dividend yield and total return implies that there is a trade-off, that an investor who emphasizes one will have to compromise on the other.
We do not think this is true. Although we agree that (after-tax) total return should be the ultimate goal of investing, we believe that owning stocks with a higher dividend yield is an excellent way to maximize total return.
Higher Dividend Stock Performance
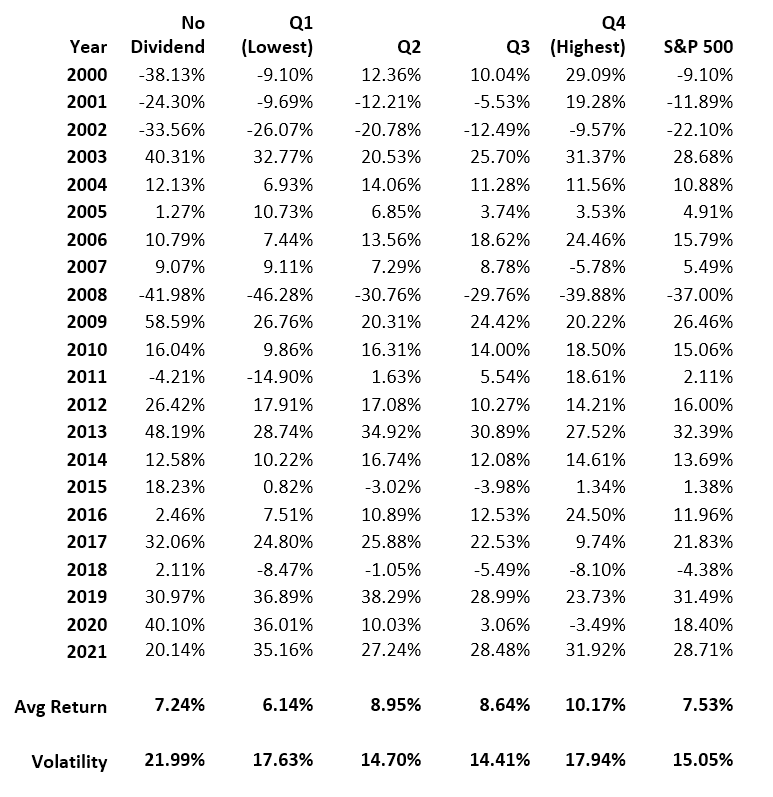
We here examine the total return of S&P 500 members over the first 22 years of this century, 12/31/1999 to 12/31/2021. For each month, we divided the S&P into five capitalization weighted segments: a segment made of stocks that paid no dividends and four segments of dividend paying stocks sorted by lowest to highest yield.
A reasonable person might expect that if higher yielding stocks are superior, then the highest yielding stocks would perform best, that is, that performance improves as yield rises, and that non-dividend paying stocks would do the worst. As it turns out, the highest yielding stocks do perform best, but the non-yielding stocks are not the worst.
Below is the cumulative return chart for these five index segments over our 22-year analysis period.
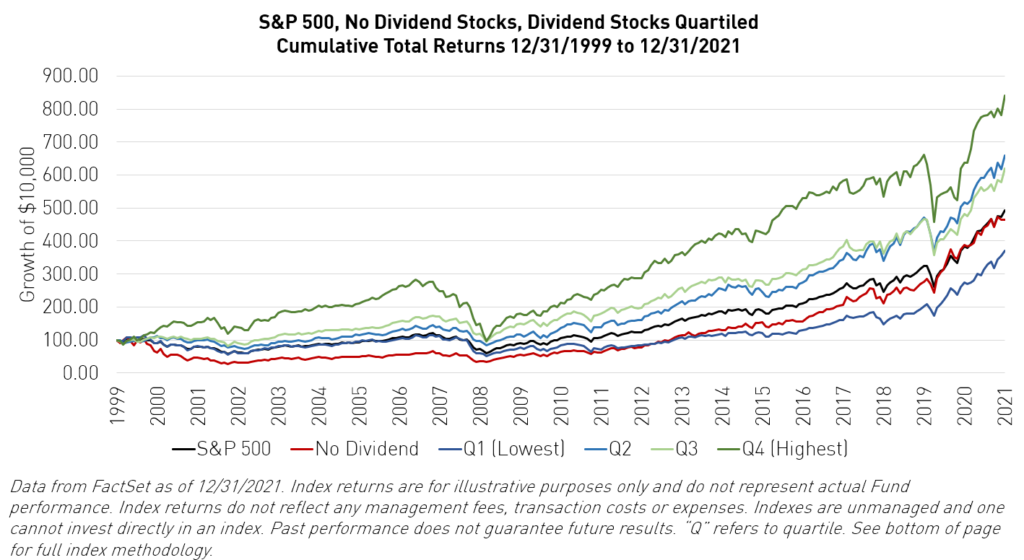
Somewhat surprisingly, the no dividend stocks hold their own over the 264 months. After falling behind the S&P in the early going they catch up in the final years, ending with very nearly the same total return, albeit with much higher volatility. Then again, as this group tended to include the very large growth stocks discussed above, this recent performance should perhaps be expected.
Not so surprisingly, the highest dividend payers (Q4) had the highest total returns of the five index segments, easily outpacing the S&P. However, and this is an important point, this segment experienced higher volatility than the S&P or any of the other dividend paying quartiles. This segment of approximately 100 highest yielding stocks is not as well diversified and is riskier than the S&P.
The middle two dividend quartiles (Q2 and Q3) gained approximately the same returns over the period, both modestly outperforming the S&P, while experiencing similar volatility.
By far the worst performer here was the lowest quartile of dividend payers (Q1.) It did worse than the S&P and also, significantly, worse than the segment of non-dividend payers. Not only were large dividends better than small ones, but the smallest dividend payers are worse than no dividend at all.
Why Do High Dividends Pay?
A thoughtful argument can be made that dividend yield should not affect total returns. After all, a stock that pays a dollar dividend goes down in price by exactly one dollar when the payment is accrued. And there is a powerful logic to this. The shareholder has another dollar in cash, but the company is now a dollar per share poorer. The shareholder should be no better or worse off when the dust settles.
There is even the argument that companies that pay dividends must have poor growth prospects. Otherwise, they would retain their profits to reinvest in the business. And there may be some truth in that, as evidenced by the relatively strong performance above of the non-payers vs. the low-payers.
Our view is that high dividends are attractive not because paying them creates value, but because they are a signal that says good things about the company. The kind of stocks that pay a meaningful dividend are the kind of stocks that should outperform.
A board of directors that sets a healthy dividend is saying at least three positive things about their company. First, they are telling the world that the company is profitable and that they expect it to remain so for the foreseeable future. Decreasing dividend payout is considered to be a very negative event with a heavy stigma, so setting a large dividend is something of a commitment and an indication of confidence.
Second, higher dividends imply the company is efficiently run and that it takes shareholder interests seriously. As dismal as it may sound that a company might not have a better use for spare cash than to send it to shareholders, investors are commonly confronted with the opposite problem, that companies retain earnings when sending the money to shareholders would be the value maximizing move. It is human nature to be optimistic, and it is only natural for managers to believe that the exciting new investments available inside their businesses are more attractive than whatever the shareholders might do with the cash. A company that pays a high dividend is overcoming this bias and sends a message that it is a shareholder oriented tight ship.
Thirdly, a high dividend is a valuation signal. A board of directors that sets a higher than typical dividend yield is saying, among other things, that they believe the stock price is too low. Similarly, a board that sets a low dividend is signaling that they think the stock is overpriced and that they expect that their yield will naturally rise as the stock price falls.
KVLE
Higher dividend yielding stocks should be attractive not just to “income investors” but to all “total return investors.” A significant dividend is generally a strong positive signal from company insiders of confidence in the future of the business, as well as a pro-shareholder orientation.
What is particularly attractive about higher yield as a strategy is that it allows for well diversified portfolios in a way that most “theme” strategies do not. Our KFA Value Line® Dynamic Core Equity Index ETF (Ticker: KVLE) is a broadly diversified core equity portfolio that is tilted in favor of dividend yield. Holdings are selected, and weights are chosen, with an eye to increasing yield, without investing exclusively in high yield stocks and sectors.
The bulk of the potential benefit from yield investing is not in holding a small number of the highest yielding names but in avoiding the small number of the lowest yielding ones. That means that an investor can own a broadly diversified and lower risk portfolio and still take full advantage of the potential benefit from owning higher yielding stocks, something that is implemented methodically in KVLE.
*Diversification does not ensure a profit or guarantee against a loss.
Methodology: Each index segment was rebalanced at the start of each of 252 months covering the period 12/31/1999 to 12/31/2021. Stocks were assigned to segments based on then current dividend yield. Segments were cap weighted, based on total equity capitalization at the start of each month. All data sourced from FactSet. Monthly returns were calculated as the weighted average of total returns, with dividends reinvested. Stocks that were missing either dividend yield or total return in the FactSet database were excluded for that month’s calculation. (Excluded stocks averaged 0.32% of S&P weight in total.) All returns are gross and include no fees or transaction costs.
Note: KVLE's index does not track the S&P 500 index. However, the S&P 500 is used in the above analysis because the fund's index, the 3D/L Value Line® Dynamic Core Equity Index, is constructed from the S&P 500 index's constituents.
Index Definitions:
S&P 500: widely regarded as the best single gauge of large-cap U.S. equities. The index includes 500 leading companies and covers approximately 80% of available market capitalization.
r-ks-sei