


The Keys to Dividend Investing in a Post-Covid World: Equal Weighting & Momentum

The stock market in 2020 has not been a place for the fainthearted. Soaring volatility and soaring tech stocks have left investors with either inexplicable gains amidst a US economy that continues to struggle under the weight of Covid-19 shutdowns and rising cases or a feeling that they have missed out on the market rally entirely. Furthermore, it appears that the winning strategy in the US market this year has been either big tech or tracking the indexes that hold big tech.
However, the tremendous success of big tech during the coronavirus pandemic comes with an often-overlooked risk: concentration. Over 20% of the S&P 500 is now comprised of only ten stocks, most of which are big tech names.1 It turns out that many diversified portfolios may no longer be as diversified as we would have hoped.
Additionally, many of these stocks are notorious for their puny or nonexistent dividends, meaning that their past and future performance is all based on capital appreciation. Facebook, for example, currently has a dividend payout ratio of zero. While capital appreciation is great, dividend reinvestment has accounted for nearly 50% of the S&P 500’s total return over the past thirty years.2 Thus, a portfolio tracking the S&P 500 is, at present, lacking in diversity of both companies, due to the high weighting to the top ten companies in the index, and sources of return, due to the low dividend yields of those top companies.

An equal-weighted dividend strategy may offer a solution to both of these issues and provide a worthwhile complement to a broad-market or market-capitalization weighted index exposure such as an ETF or mutual fund that tracks the S&P 500.
Equal-weight indexes are precisely what the name suggests. Each constituent of the index is assigned the same weight. If there are 100 constituents of the index, then the weight of each is 1%. This reduces single-stock risk and significantly reduces other types of concentration risk.
Furthermore, equal weightings enforce discipline upon an index. By assigning each company the same weight, no one company will be overweighted due to a rise in its market capitalization. Another consequence of equal weighting is that the index will, in effect, be “buying low and selling high” most of the time as constituents with high prices are pushed out to make room for new constituents that are cheaper. By contrast, the S&P 500 goes through long periods of “buying high” as it is mandated to increase its weightings of constituents whose market capitalizations rise. This is occurring in funds that track the index today as tech shares continue to soar.
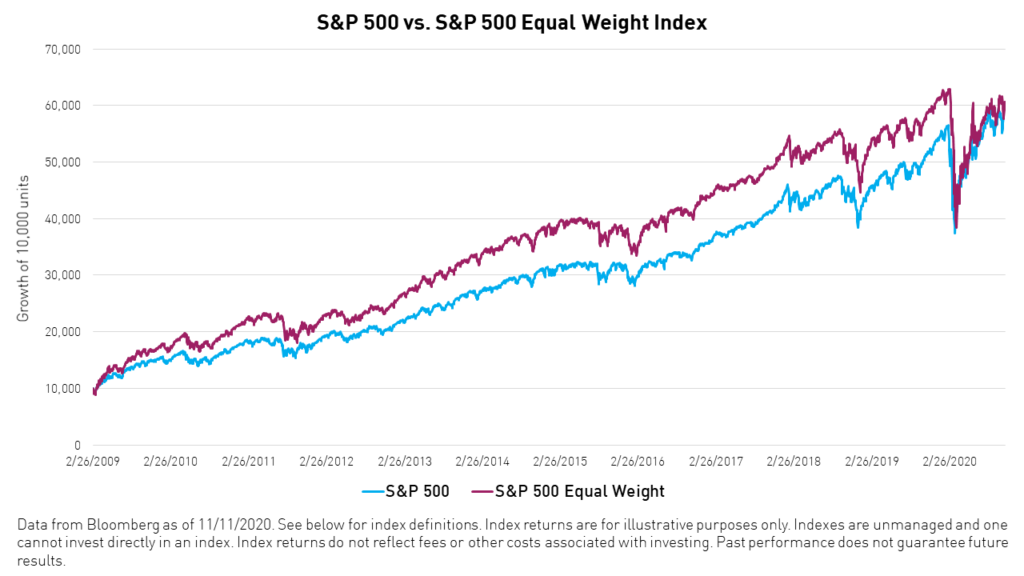
Equal weight strategies have a strong track record of outperforming market capitalization-weighted strategies over the long term.
Equal weighting is especially useful for an allocation to dividend paying and dividend growing stocks. An investor who places a high value on current income may be inclined to hold on to a stock that pays a healthy dividend even as its price depreciates. An equal weight dividend strategy seeks to maintain a high level of current income while also continuing to buy low and sell high.
Investors with long-term horizons often shun dividend-paying stocks due to the likelihood that they are issued by slow-growing companies that send a large portion of profits back to investors rather than investing it in growing the business. This is where momentum comes in. Momentum strategies seek to buy when a particular stock appears to be on an upswing and sell when a particular stock appears to be on a downswing. Applying a momentum strategy to dividend paying stocks means the potential ability to filter out those slow-growing companies that pay dividends at the expense of the long-term growth of their businesses.
Additionally, it is worth noting that dividend paying and dividend growing stocks have largely fallen out of favor this year due to increasing economic uncertainty. As a result, the valuations of these companies are favorable compared to the broad market, presenting a potential buying opportunity.
However, to the extent that a rotation into dividend paying stocks is a rotation into value stocks, many could be cheap for a reason and are not good investments. Screening out the justifiably cheap stocks is, therefore, of paramount importance. Applying a momentum filter to stocks that not only reliably pay, but also grow, their dividends can help accomplish exactly that.
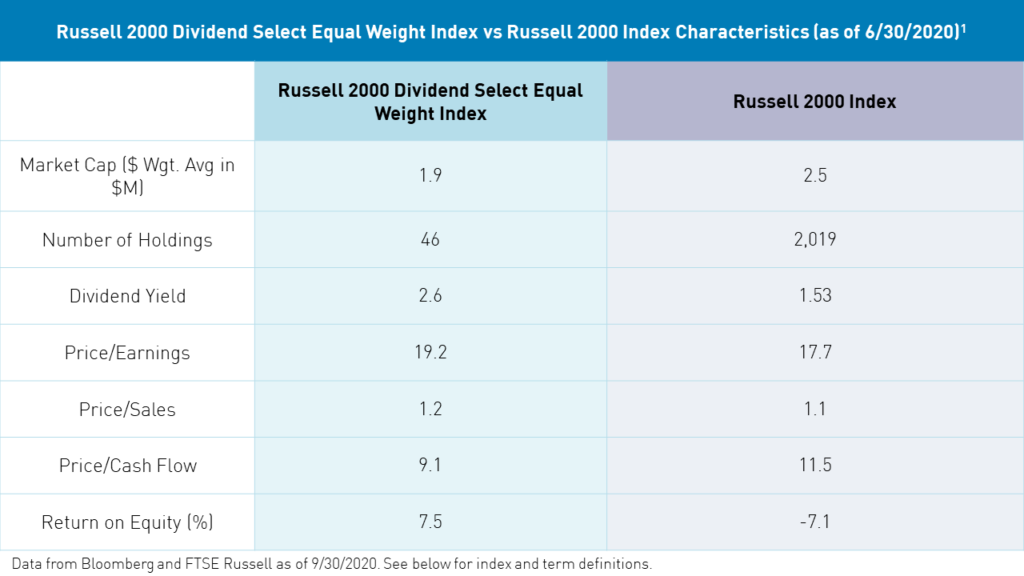
The tables below illustrate differences in the characteristics of the companies in the Russell 1000 and 2000 indexes and those in their equal weight dividend versions with momentum filters. Evidently, the companies in the latter generally exhibit higher returns on equity, higher dividend yields, and more favorable valuations.

The KLCD and KSCD ETFs utilize an equal-weighted strategy and a momentum filter to invest in both US large cap (KLCD) and US small cap (KSCD) equities that have successfully grown their dividends over the past 10 years.
Now could be the time to consider complementing or replacing a broad US market exposure with an equal-weight dividend strategy. At present, broad-market indexes are highly concentrated in a handful of stocks that pay no dividend while dividend paying stocks come at a steep discount to their growthy peers. An equal weight dividend strategy with a momentum filter can reintroduce dividends as a component of total return while maintaining capital appreciation.
Diversification does not ensure a profit or guarantee against a loss.
Citations
- Data from Bloomberg as of 10/30/2020
- Data from Bloomberg as of 9/30/2020
Index Definitions
S&P 500 Index: The S&P 500 Index is widely regarded as the best single gauge of large-cap U.S. equities. There is over USD 9.9 trillion indexed or benchmarked to the index, with indexed assets comprising approximately USD 3.4 trillion of this total. The index includes 500 leading companies and covers approximately 80% of available market capitalization. The index was launched on March 4, 1957.
S&P 500 Equal Weight Index: The S&P 500 Equal Weight Index (EWI) is the equal-weight version of the S&P 500. The index includes the same constituents as the capitalization weighted S&P 500, but each company in the S&P 500 EWI is allocated a fixed weight of approximately 0.2% of the index total at each quarterly rebalance. The index was launched on January 8, 2003.
Russell 1000 Index: This index is comprised of the largest 1000 companies in the Russell 3000 Index, This index represents the universe of large capitalization stocks from which most active money managers typically select. The index was developed with a base value of 130.00 as of December 31, 1986.
Russell 1000 Dividend Select Equal Weight Index: This index is designed to measure the performance of US companies that have successfully increased their dividend payments over a period of ten years. On a quarterly basis the highest ranking companies based on momentum are selected and equally weighted to form the final index, capturing the large cap domestic market. The index is designed to provide a benchmark for investors looking to capture a concentrated portfolio of constituents demonstrating increased dividends and positive momentum. The index was launched on April 7, 2019.
Russell 2000 Index: This index is comprised of the smallest 2000 companies in the Russell 3000 Index, representing approximately 8% of the Russell total market capitalization. The real-time value is calculated with a base value of 135 as of December 31, 1986. The end-of-day value is calculated with a base value of 100 as of December 29, 1978.
Russell 2000 Dividend Select Equal Weight Index: This index is designed to measure the performance of US companies that have successfully increased their dividend payments over a period of ten years. On a quarterly basis the highest-ranking companies based on momentum are selected and equally weighted to form the final index, capturing the large cap domestic market. The index is designed to provide a benchmark for investors looking to capture a concentrated portfolio of constituents demonstrating increased dividends and positive momentum. The index was launched on April 7, 2019.
Term Definitions
Dividend Payout Ratio: The ratio of the total amount of dividends paid out to shareholders relative to the net income of the company. It is the percentage of earnings paid to shareholders in the form of dividends. A company's dividend payout ratio can be expressed by the formula: dividends/net income.
Price/Earnings: The ratio of a company’s share price compared to its earnings per share over a period of time. P/E is expressed by the formula: market value per share/earnings per share.
Price/Sales: The ratio of a companies share price to its sales (revenue) per share for the most recent reporting period.
Price/Cash Flow: The ratio of a company’s share price to its operating cash flow per share. Price/Cash flow is expressed by the formula: Share price/operating cash flow per share.
Return on Equity: A measure of how effectively management is using a company’s assets to create profits. Return on equity is expressed by the formula: net income/shareholders’ equity.
Dividend Yield: The ratio of a company’s annual dividend compared to its share price. Dividend yield is expressed by the formula: annual dividend/share price.