


Inflation, Bear Markets, and How KVLE Remains Resilient

The second quarter of 2022 was another challenging one for equity markets. The S&P 500 gave up -16.10% on a total return basis, continuing the downward trend from last quarter. Compounding this fact, the S&P was down -19.96% year-to-date (YTD). It was the worst first-half performance for the index since 1970. In contrast, our own KFA Value Line® Dynamic Core Equity Index ETF (Ticker: KVLE) did comparatively well, -8.09% for the quarter and -9.76% for the first half. For the last 18 months, KVLE was ahead of the S&P 500 by +15.53% vs. +3.01%.
KVLE is benchmarked to the 3D/L Value Line® Dynamic Core Equity Index, which introduces a market adaptive approach to investing in US large-cap companies. The strategy seeks to capture quality US companies based on a three-factor process that selects stocks with high dividend yields and are the highest rated among Value Line®’s Safety™ and Timeliness™ Ranking Systems. Careful quantitative modeling, that incorporates a unique set of risk management tools, adjusts the beta of the overall portfolio based on the market environment. The index is rebalanced monthly.
The performance data quoted represents past performance. Past performance does not guarantee future results. The investment return and principal value of an investment will fluctuate such that an investor’s shares, when sold or redeemed, may be worth more or less than their original cost, and current performance may be lower or higher than the performance quoted. For performance data current to the most recent month end, please call 646-895-9009 or visit our website at www.kfafunds.com.
For KVLE standard performance, top 10 holdings, risks, and other fund information, please click here.
The word for bear in Germanic languages (English included) is a cognate of “brown” rather than the root used by most Indo-European languages that resulted in, for example, the Latin word Ursus. This is thought to be a relic of the world’s oldest euphemism. Germanic tribes inhabiting the forests of northern Europe feared that if you said the word for bear, one might appear, so they called it the brown animal instead.
A similar superstition seemed to grip market observers over the early part of this year. Those who felt we were in a bear market greatly outnumbered those who would say so out loud. The reluctance to say "bear" has now dissipated. A longer-term chart of the S&P 500 is pretty convincing. After years of steady and tidy gains, the line makes a distinct right turn at the start of this year and proceeds almost as tidily downwards. Indeed, the all-time high was on the first trading day of this year, so the bear market began and continues to trudge forward in 2022, which seems much more coincidental. New year, new market regime.
We often point out that bear markets (and bull markets) do not require a logical driver. Sometimes, perhaps most times, the market falls or rises purely because of unmeasurable and irrational feelings. But sometimes, bear markets do have recognizable and explainable drivers. This one does. Ultimately, it is COVID, via the aggressively expansionist monetary policy that most Western countries implemented as a reaction to the pandemic.
For some time now, we have been writing about the natural result of the US money supply (M2) increasing by 40% over 2020 and 2021, namely inflation and a lot of it. We have never considered this prediction to be particularly insightful. Instead, we thought the relationship between a swelling M2 and subsequent inflation to be an elementary tenet of orthodox late 20th-century macroeconomics.
Navigating an inflation-driven bear market is difficult for investors. For at least a generation, the spontaneous “risk-off” reaction to trouble has been to invest in fixed income. But that is a terrible place to be under inflation. Dollars lent today will be paid back with less valuable dollars in the future. In principle, it could be said that the fixed income markets have fully accounted for inflation by now, and the higher rates we see today will compensate bond buyers for shrinking dollars.
We are not so sure. Indeed, our biggest challenge in anticipating the near future in the market is that we do not have a clear idea of what market expectations now are.
We often find ourselves returning to the “breakeven” inflation rate as forecasted by the price of inflation-protected bonds (TIPS) and their ordinary Treasury bond counterparts. For those who might find this number a bit esoteric, it should be emphasized how simple and direct the calculation is. The US Treasury issues nearly identical bonds that differ only because one type of bond has a principal indexed to inflation and the other does not. The indexed varieties (TIPS) yield essentially is Y% + I%, where I% is whatever inflation turns out to be, while the common bonds have a yield of X%. The breakeven rate is X% - Y%, that is, the value of I% such that the bonds will pay the same return.
If you expect inflation to be higher than the breakeven rate, you can buy the TIPS and short the matching regular Treasury bond. You can buy the Treasury and short the TIPS if you think inflation will be lower. This is a trade any individual can do in their retail brokerage account, generally with leverage much higher than what is available for equities.
Below is a chart that shows the breakeven rate on five-year bonds as tracked by the Federal Reserve Bank of St. Louis.
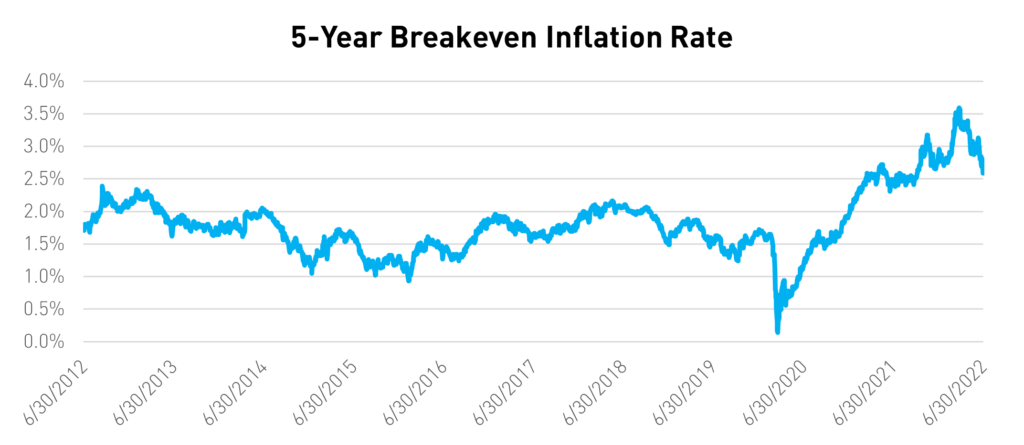
Three points on this chart strike us as nearly inexplicable.
The first is that the five-year breakeven rate from June 29th, 2022, is just 2.59%. Given that the Consumer Price Index (CPI, the index used by TIPS) showed annual inflation of over 7% in each of the three monthly reports during the first quarter and then around 8% for each of the three-second quarter reports, this five-year projection seems wildly optimistic. If inflation ran at 8% for the next year, it would have to run at just 1.28% annually for the next four years to hit the breakeven rate.
The second remarkable point is that 2.59% is not incredibly out of line in the context of the past ten years. Before the pandemic, the breakeven rate ranged from about 1% to about 2.5%, roughly in line with inflation. Indeed the post-pandemic world is meaningfully different.
But the most remarkable point on this chart, and the one hardest to fathom, is that the breakeven rate fell by a meaningful amount during the second quarter. It hit its all-time high on March 25th, at 3.59%. But with over three months of negative inflation news and increasingly dire warnings from the Fed, the market’s inflation expectations somehow fell by more than a percent.
We freely admit to being puzzled by the inflation outlook implied by the breakeven rate. We can think of three possible interpretations.
First, is that we are misunderstanding or misinterpreting the breakeven calculation in some fundamental way. Intellectual honesty forces us to suggest this, but we are confident it is not the case. The breakeven calculation is straightforward. Indeed, one of the stated objectives for launching TIPS a few decades ago was to provide an easy-to-calculate market inflation expectation.
Second, the fixed income markets are in such a poor state that the pricing used here is either distorted or inaccurate. For example, it might be supposed that since the regular Treasury bonds are more liquid than their TIPS counterparts, they might carry a liquidity premium which would depress their yields. That premium might have increased over the past few months as the bear market progressed. We think this is likely correct but too small an effect to explain what we see.
Third and lastly, the chart should be taken at face value, and the market expectations for inflation over the next few years are lowering. This, despite actual inflation numbers that are far above what was expected six or twelve months ago, despite a should-be-obvious reason to expect inflation, and despite a Fed that has made it clear that inflation is now severe enough a problem that it is willing to risk inducing a recession to fight it.
We think the third interpretation is the least implausible of the three. Its implications are troubling, mainly if the market’s overly optimistic view on inflation is not realized, which seems likely. Indeed, if inflation is strong enough, we could easily see a recession as collateral damage in the Fed’s efforts to stop it. And that suggests that the bear market will continue for a while, whether or not we say it out loud.
Last quarter we believed that KVLE was favorably positioned for a rocky 2022 in the markets as companies with solid balance sheets that pay consistent or growing dividends may do well in times of difficulty. So far, our thesis has proven true as KVLE has outperformed the S&P 500 by more than 10% in 2022. Since we foresee continued market challenges in the second half of 2022, we believe KVLE may continue to be similarly well-positioned.
At the same time, we do not think further trouble is required for KVLE to prosper. This could be as bad as it gets. Perhaps the inflation dragon will be slain soon and without a recession. In that case, we would still expect an ETF like KVLE that's comprised of quality US companies to do well in the aftermath of the crisis. KVLE did, after all, outperform the S&P during 2021 as well.
Index Definitions:
S&P 500 - is an American stock market index based on the market capitalizations of 500 large companies having common stock listed on the NYSE or NASDAQ.
Consumer Price Index (CPI) - a measure of the average change over time in the prices paid by urban consumers for a market basket of consumer goods and services.
Term Definition:
Treasury Inflation-Protected Securities (TIPS) - provide protection against inflation. The principal of a TIPS increases with inflation and decreases with deflation, as measured by the Consumer Price Index.